Fig. 3
Download original image
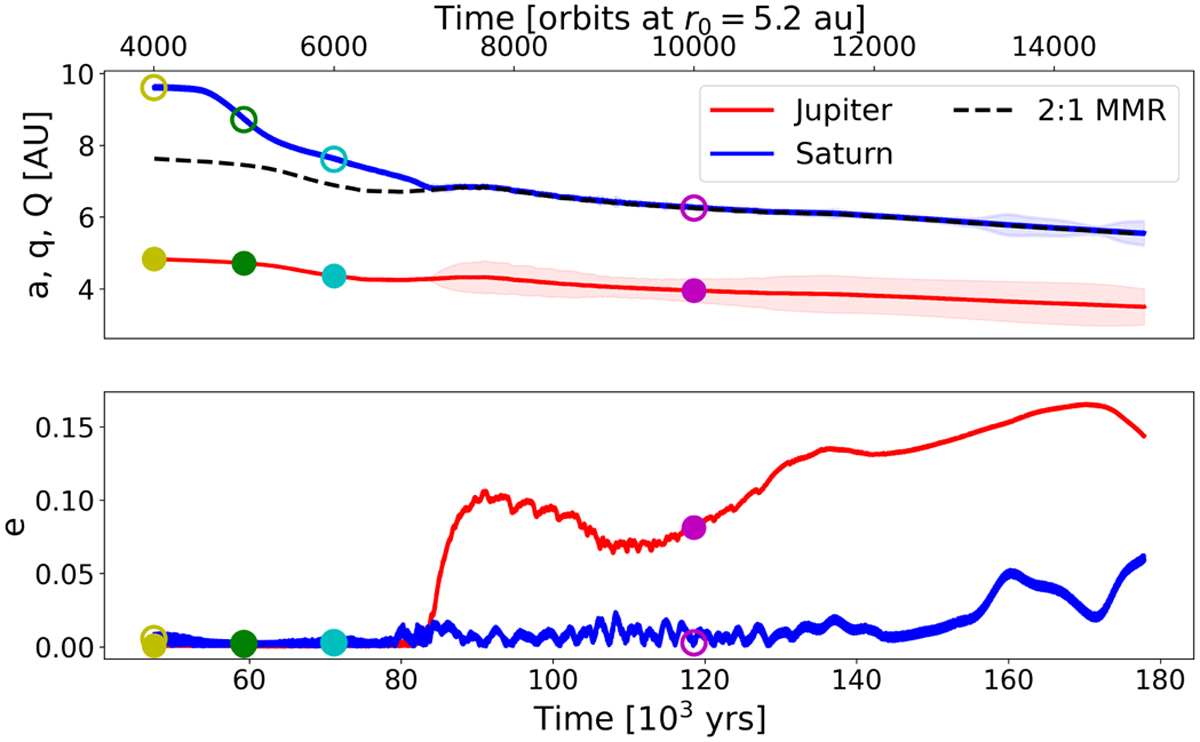
Orbital parameters’ evolution of Jupiter and Saturn in the nominal simulation. The top panel shows the semi-major axes of Jupiter in red and Saturn in blue. The shaded areas mark the positions of the peri-and apo-centre, q = a(1 − e) and Q = a(1 + e), of the planets, respectively. The black dashed line marks the position of the 2:1 resonance with Jupiter. The bottom panel shows the eccentricities of the planets. At the start of these curves, Jupiter is fully grown, while Saturn reaches its final mass around 72 700 yr. The coloured markers indicate the times at which the surface density is represented in the four panels of Fig. 2.
Current usage metrics show cumulative count of Article Views (full-text article views including HTML views, PDF and ePub downloads, according to the available data) and Abstracts Views on Vision4Press platform.
Data correspond to usage on the plateform after 2015. The current usage metrics is available 48-96 hours after online publication and is updated daily on week days.
Initial download of the metrics may take a while.