Fig. 2
Download original image
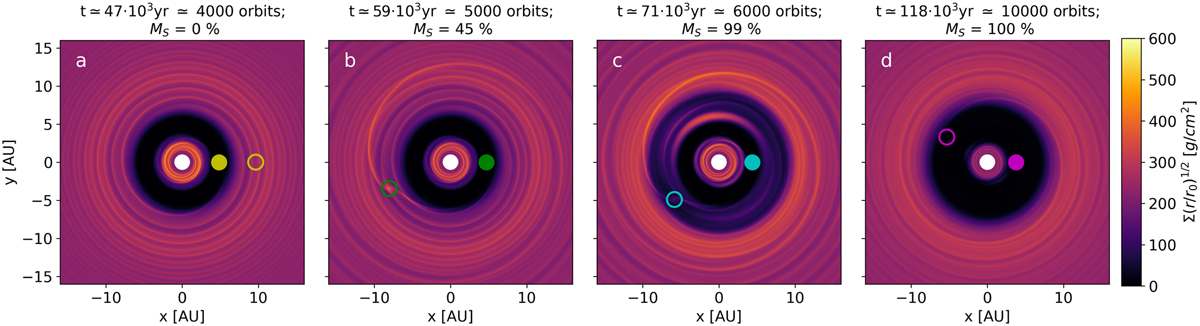
Surface density of the disc at different times of the nominal simulation. The filled and empty circles mark the positions of Jupiter and Saturn, respectively. Panel a shows the disc at the moment of introduction of Saturn, T0‚S, while the outer planet still has zero mass. In panel b, the planet is at 45% of its total mass. In panel c, the planet is just about to reach its final mass. Panel d shows the disc and the planets closer to the end of the simulation. At this point both planets are in a large common gap and locked in the 2:1 MMR. The colours given to the planets correspond to the markers in Fig. 3.
Current usage metrics show cumulative count of Article Views (full-text article views including HTML views, PDF and ePub downloads, according to the available data) and Abstracts Views on Vision4Press platform.
Data correspond to usage on the plateform after 2015. The current usage metrics is available 48-96 hours after online publication and is updated daily on week days.
Initial download of the metrics may take a while.