Fig. B.1
Download original image
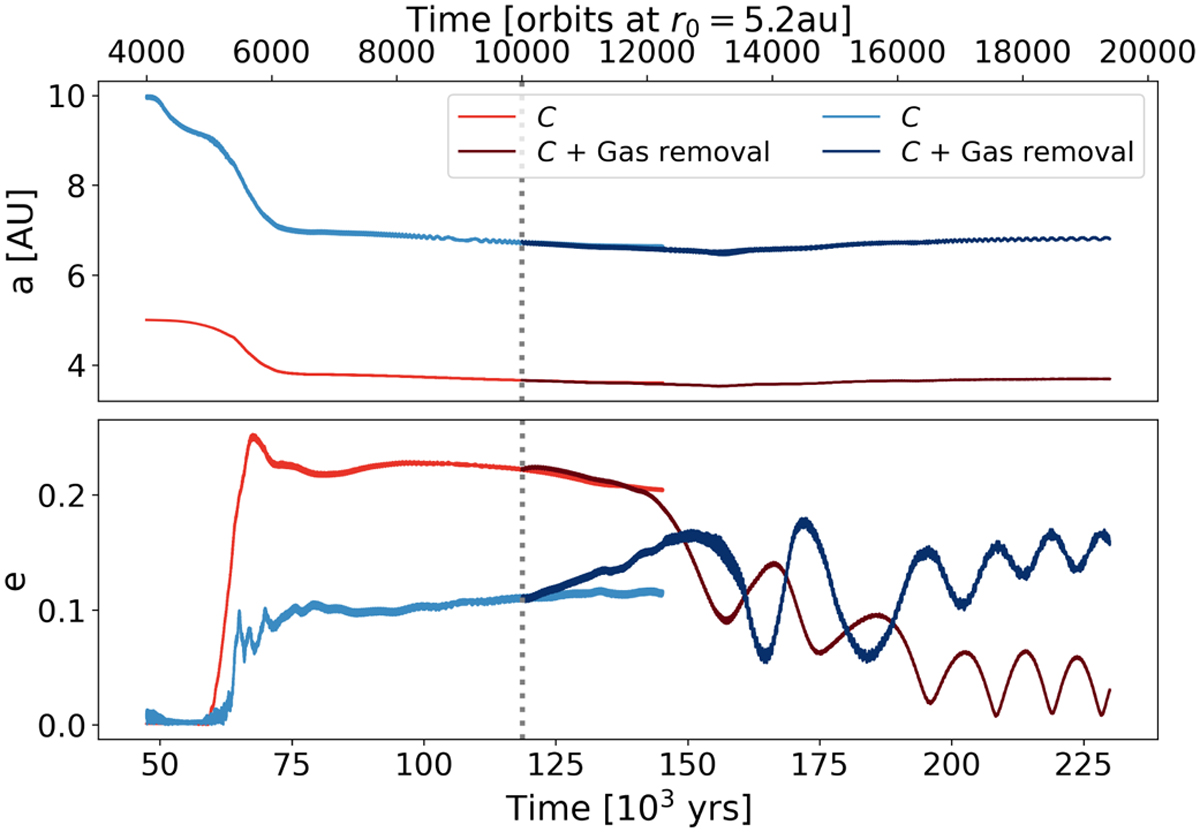
Orbital evolution of Jupiter and Saturn for simulation set C. The top and bottom panels show the semi-major axis and the eccentricity, respectively. The vertical dotted lines indicate the time t0 at which we started the simulation with gas removal, namely ’C + Gas removal’. The nominal simulation was continued for t > t0 until a significant difference appeared with respect to the gas removal.
Current usage metrics show cumulative count of Article Views (full-text article views including HTML views, PDF and ePub downloads, according to the available data) and Abstracts Views on Vision4Press platform.
Data correspond to usage on the plateform after 2015. The current usage metrics is available 48-96 hours after online publication and is updated daily on week days.
Initial download of the metrics may take a while.