Fig. 12
Download original image
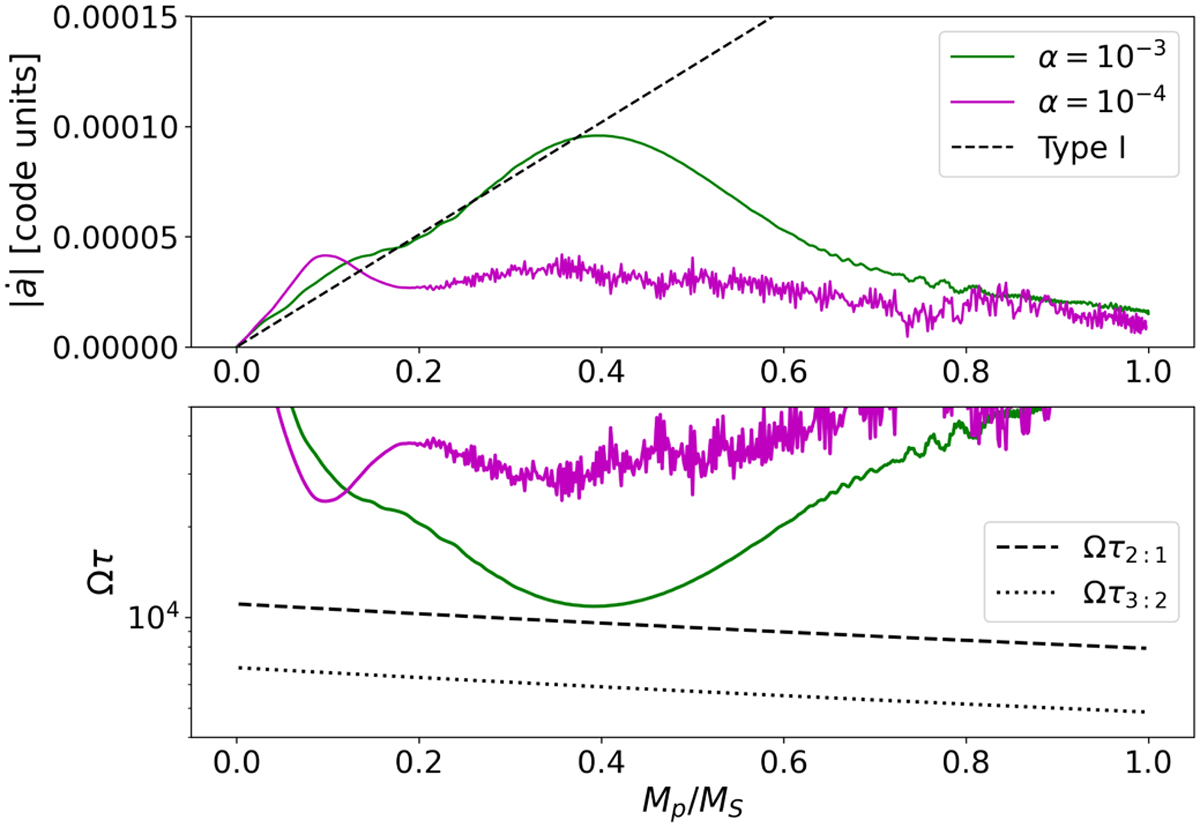
Migration speed and timescale of a growing planet in different viscous discs. Top panel: migration speed in absolute value of a planet growing from zero to Saturn’s mass, MS, in 800 initial orbital periods. The dashed black line shows the type I migration speed from Tanaka et al. (2002, at r = r0 constant). Bottom panel: migration timescale τ = a/|ȧ| normalised by the angular velocity of the planet. The black dashed and dotted lines represent the critical migration timescale, calculated with Eq. (3), beyond which the planet would cross the 2:1 or 3:2 resonance, respectively. These simulations were run for viscosities corresponding to α = 10−4 and 10−3. The migration timescales plotted in this figure were smoothed by means of a sliding window average with a size of then and 50 points (which represents a time interval of about 100 and 600 yr) for the case α = 10−3 and α = 10−4, respectively.
Current usage metrics show cumulative count of Article Views (full-text article views including HTML views, PDF and ePub downloads, according to the available data) and Abstracts Views on Vision4Press platform.
Data correspond to usage on the plateform after 2015. The current usage metrics is available 48-96 hours after online publication and is updated daily on week days.
Initial download of the metrics may take a while.