Open Access
Fig. 7
Download original image
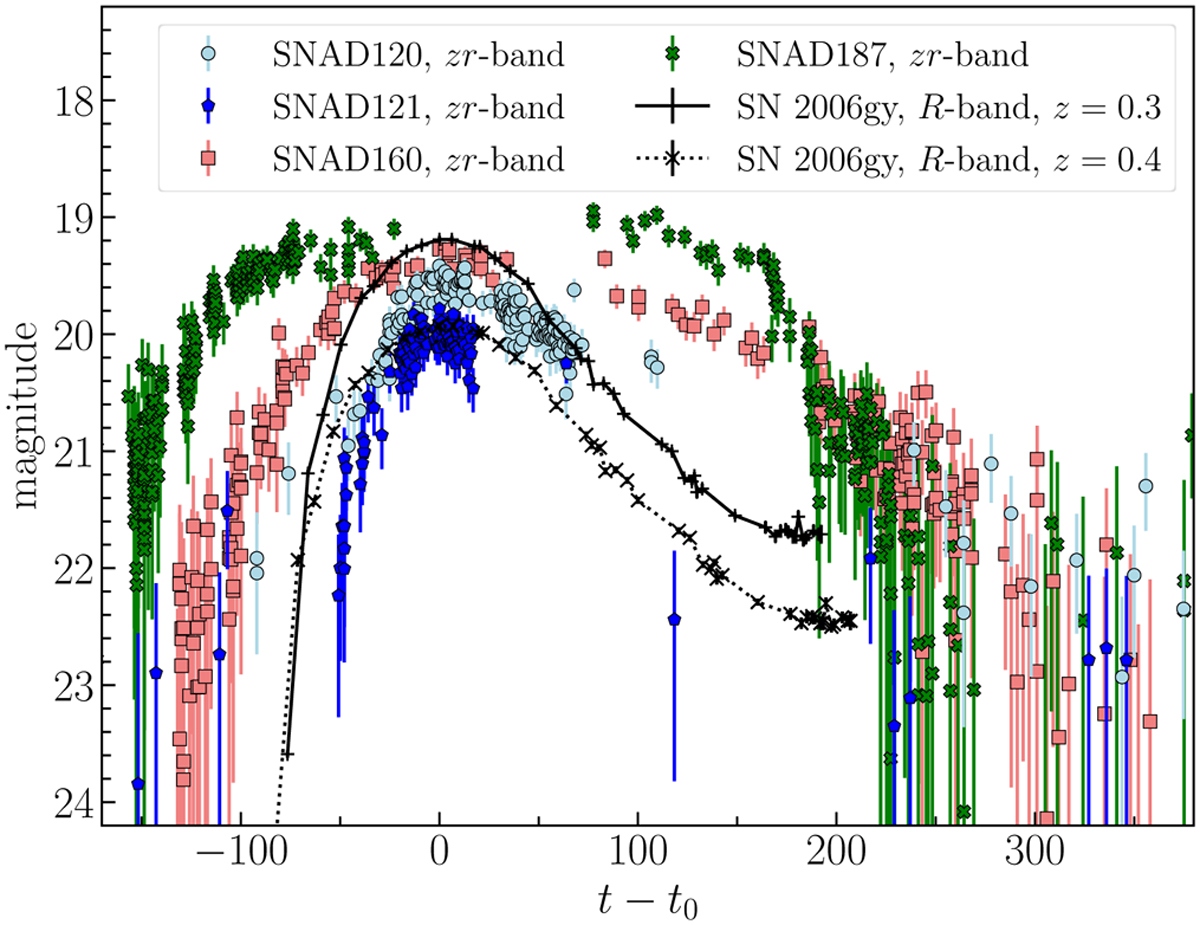
Light curves of SNAD SLSN candidates in zr-band in comparison with the R-band light curve of well-studied SLSN SN 2006gy shifted to z = 0.3 (black pluses) and z = 0.4 (black crosses). The observed magnitudes of SN 2006gy are taken from Smith et al. (2007). All the light curves are shown relative to the maximum light.
Current usage metrics show cumulative count of Article Views (full-text article views including HTML views, PDF and ePub downloads, according to the available data) and Abstracts Views on Vision4Press platform.
Data correspond to usage on the plateform after 2015. The current usage metrics is available 48-96 hours after online publication and is updated daily on week days.
Initial download of the metrics may take a while.