Fig. 1
Download original image
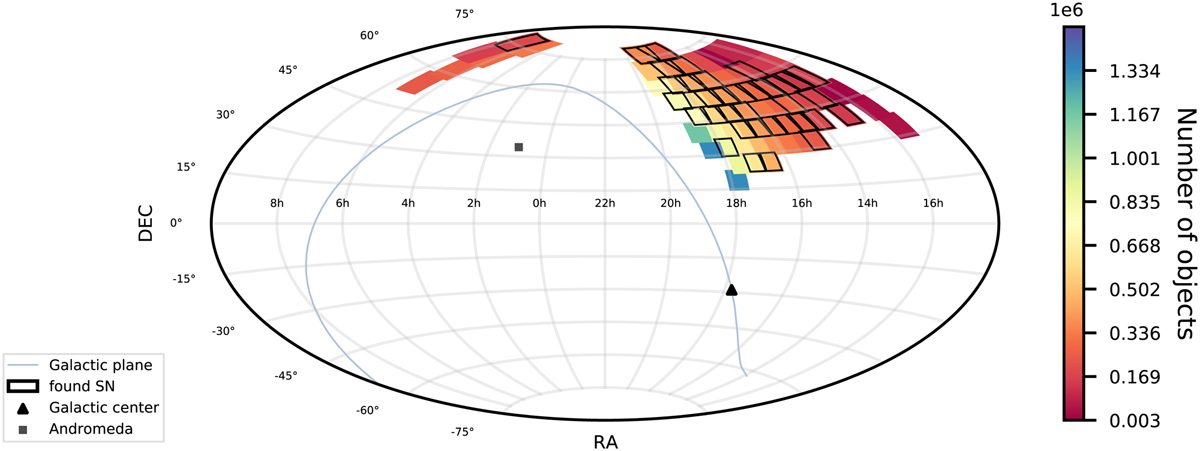
Sky map in equatorial coordinates with plotted positions of ZTF fields analysed in this work, the colour bar shows the number of objects in each field. Fields with detected supernova candidates are highlighted with bold black boundaries. The blue curve denotes the galactic plane. The black triangle marks the galactic centre and the black circle corresponds to the position of the Andromeda galaxy.
Current usage metrics show cumulative count of Article Views (full-text article views including HTML views, PDF and ePub downloads, according to the available data) and Abstracts Views on Vision4Press platform.
Data correspond to usage on the plateform after 2015. The current usage metrics is available 48-96 hours after online publication and is updated daily on week days.
Initial download of the metrics may take a while.