Fig. 4.
Download original image
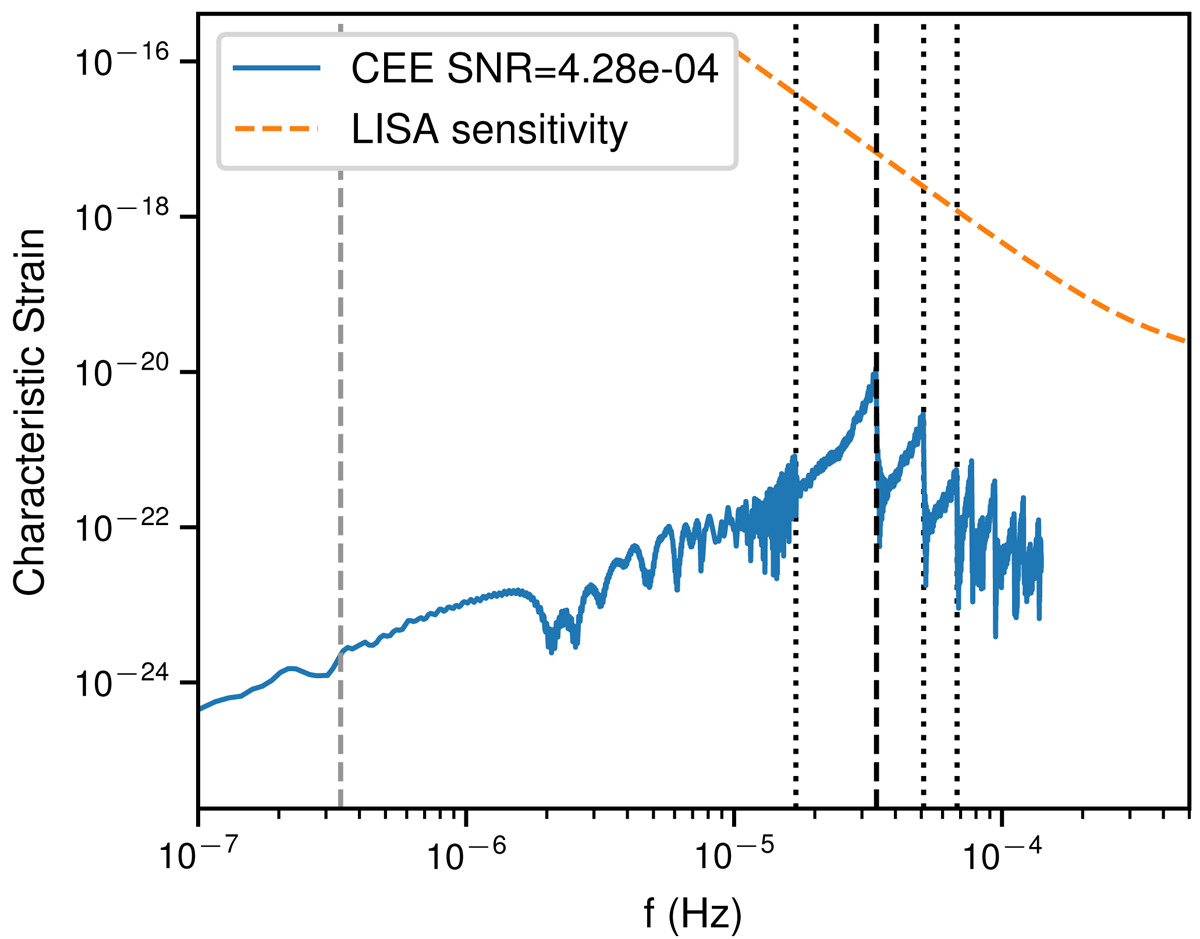
Characteristic strain of the GW signal released by the successful common-envelope ejection (in blue) assuming a distance of 1 kpc to the source. The LISA sensitivity from Robson et al. (2019) is shown by the dashed orange line. The vertical dashed gray line represents twice the orbital frequency at the beginning of the CE (assuming a perfectly circular and Keplerian motion). The dashed black line represents twice the orbital frequency after the ejection of the envelope. The dotted black lines represent the first four harmonics of the final orbital frequency (fn = n ⋅ forb, final).
Current usage metrics show cumulative count of Article Views (full-text article views including HTML views, PDF and ePub downloads, according to the available data) and Abstracts Views on Vision4Press platform.
Data correspond to usage on the plateform after 2015. The current usage metrics is available 48-96 hours after online publication and is updated daily on week days.
Initial download of the metrics may take a while.