Fig. 2.
Download original image
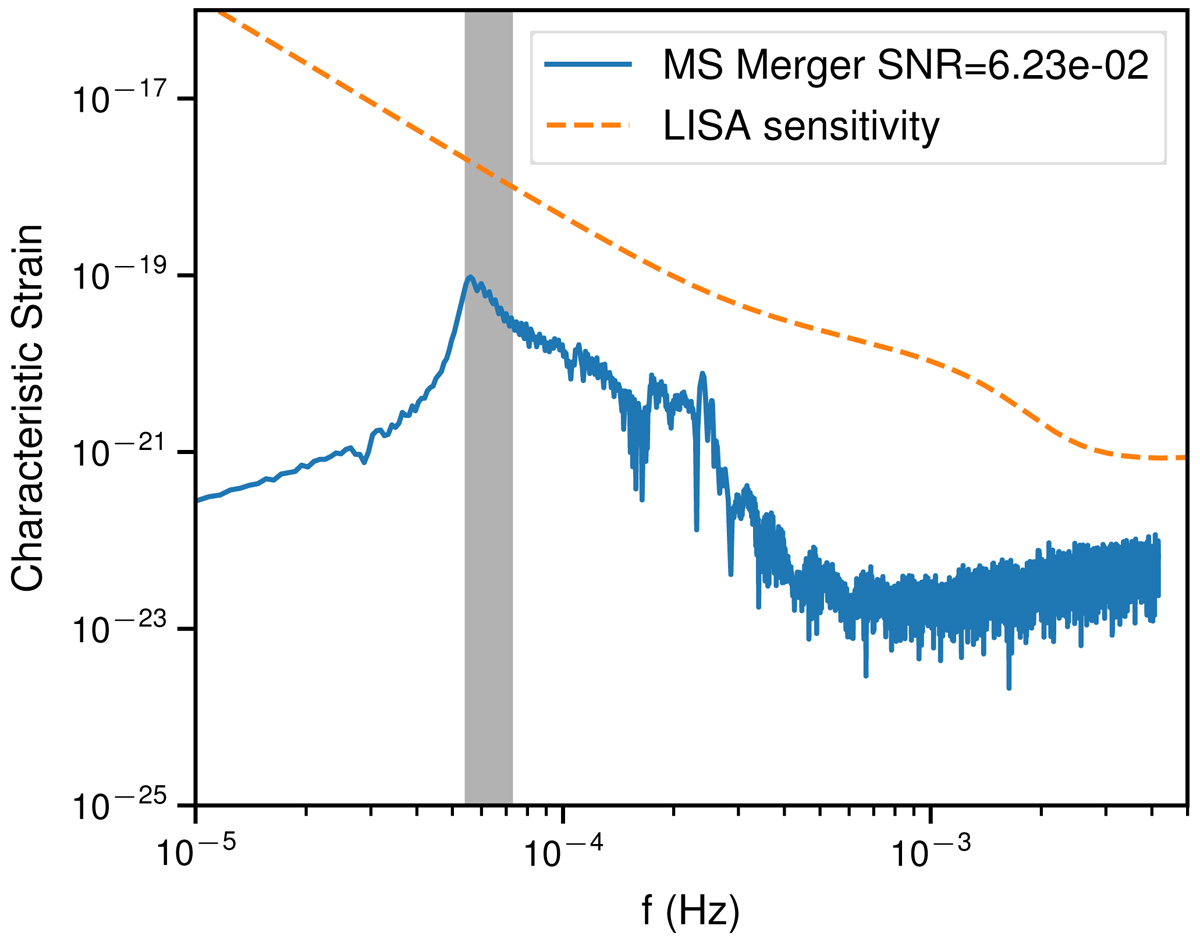
Characteristic strain of the GW signal released by the merger of two main-sequence stars (in blue) assuming a distance of 1 kpc to the source along the polar axis. The LISA sensitivity from Robson et al. (2019) is shown by the dashed orange line. The region shaded in gray represents the frequency range spanning between twice the orbital frequency at the beginning of the simulation and twice the orbital frequency at the moment the star is disrupted (assuming the orbits to be perfectly circular and Keplerian).
Current usage metrics show cumulative count of Article Views (full-text article views including HTML views, PDF and ePub downloads, according to the available data) and Abstracts Views on Vision4Press platform.
Data correspond to usage on the plateform after 2015. The current usage metrics is available 48-96 hours after online publication and is updated daily on week days.
Initial download of the metrics may take a while.