Fig. 9.
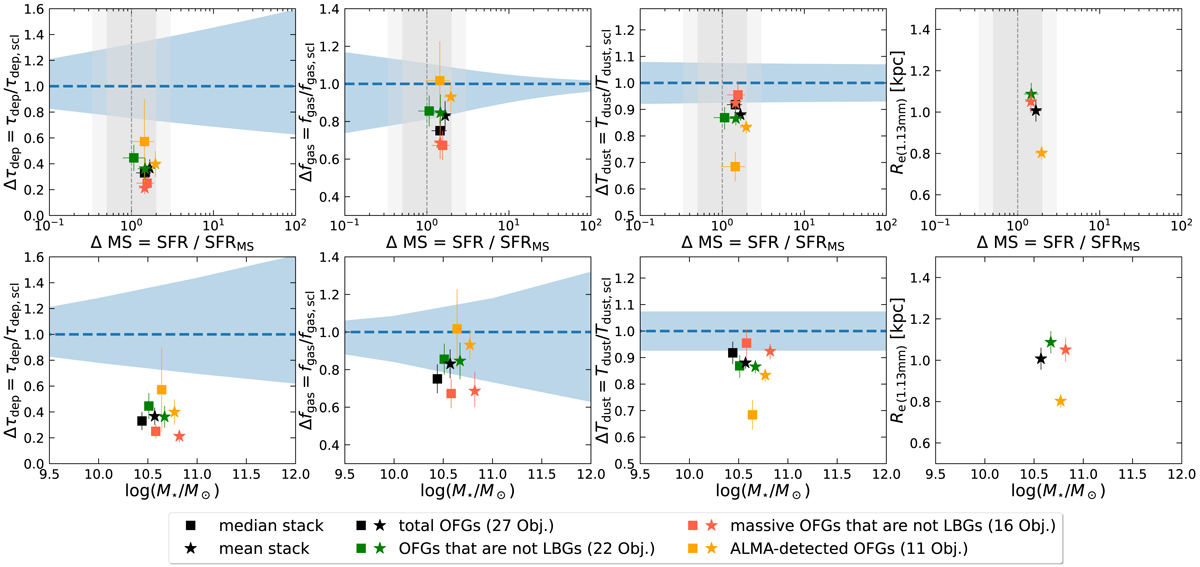
Download original image
Normalized τdep (left), fgas (mid-left), and Tdust (mid-right) by the scaling relation of τdep, scl(z, M⋆, ΔMS) and fgas, scl(z, M⋆, ΔMS) from Tacconi et al. (2018) and of Tdust, scl(z, ΔMS) from Schreiber et al. (2018c) as well as the half-light radius Re (right) at ALMA 1.13 mm as a function of ΔMS (first row) and M⋆ (second row). Here, ΔMS is the distance to the SFMS (Schreiber et al. 2015), ΔMS = SFR/SFRMS, at its own stellar mass and redshift for each sample. The blue dashed line and shaded area show the scaling relation and scatter. For each data point, the τdep, scl, fgas, scl, and Tdust, scl are calculated at a fixed redshift, stellar mass, and ΔMS. Squares, stars, and shaded grey areas are the same as in Fig. 8.
Current usage metrics show cumulative count of Article Views (full-text article views including HTML views, PDF and ePub downloads, according to the available data) and Abstracts Views on Vision4Press platform.
Data correspond to usage on the plateform after 2015. The current usage metrics is available 48-96 hours after online publication and is updated daily on week days.
Initial download of the metrics may take a while.