Fig. 8.
Download original image
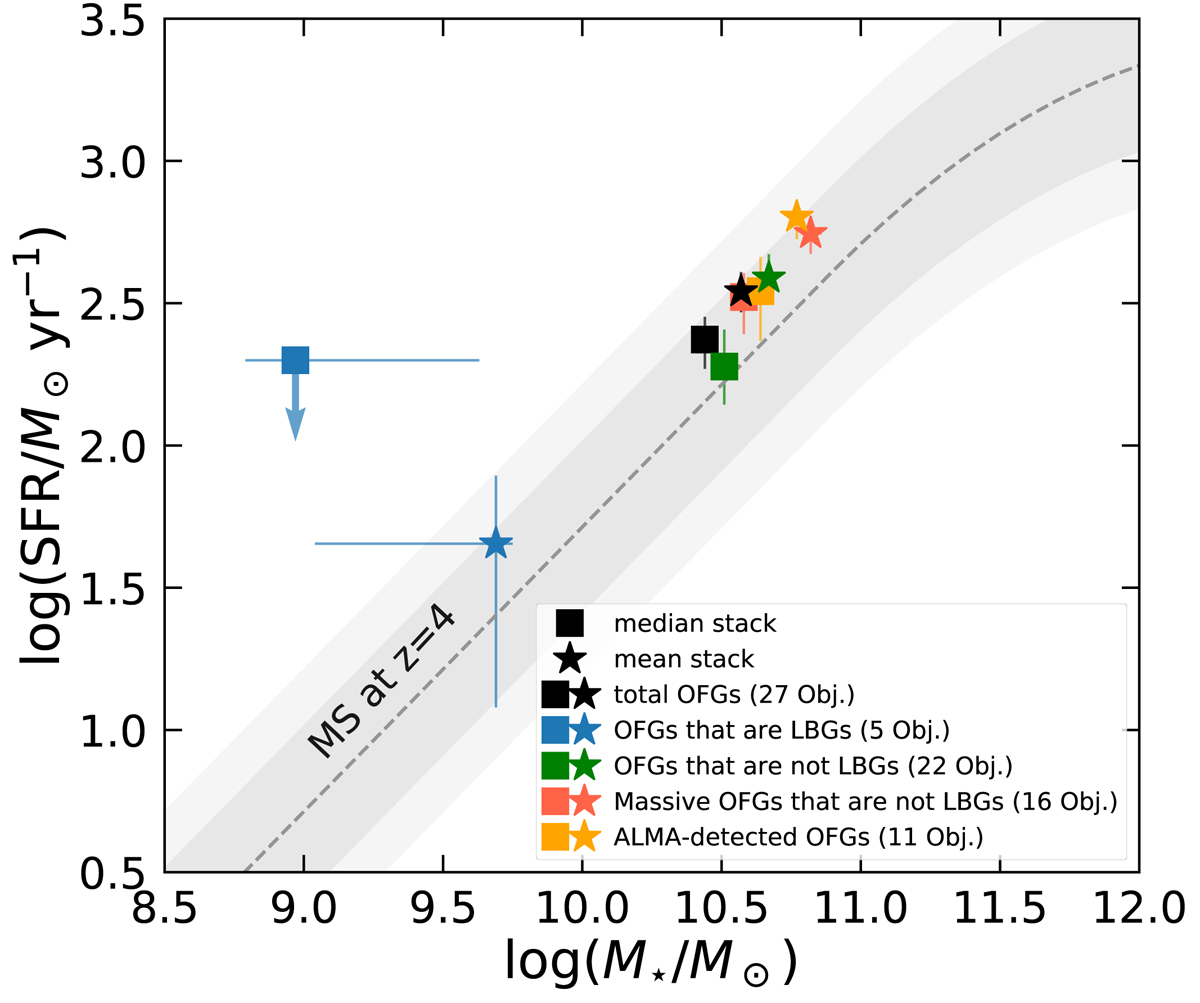
Locations of OFGs compared to the SFMS in the SFR-M⋆ plane. The SFMS at z = 4 (Schreiber et al. 2015), 1σ scatter (0.5 < ΔMS < 2, i.e., ∼0.3 dex), and ±3 × ΔMS region (0.33 < ΔMS < 3, i.e., ∼0.5 dex) are highlighted with a grey dashed line, a grey shaded area, and a light grey shaded area, respectively. ΔMS > 3 is commonly used to separate MS and SB galaxies. Squares and stars respectively represent the median and mean stacking results for our total sample (black) and four sub-samples. The four sub-samples are the OFGs that are LBGs (blue), the OFGs that are not LBGs(green), the massive OFGs that are not LBGs(red), and the OFGs with ALMA detections (orange). When necessary, data from the literature have been converted to a Chabrier (2003) IMF.
Current usage metrics show cumulative count of Article Views (full-text article views including HTML views, PDF and ePub downloads, according to the available data) and Abstracts Views on Vision4Press platform.
Data correspond to usage on the plateform after 2015. The current usage metrics is available 48-96 hours after online publication and is updated daily on week days.
Initial download of the metrics may take a while.