Fig. 7.
Download original image
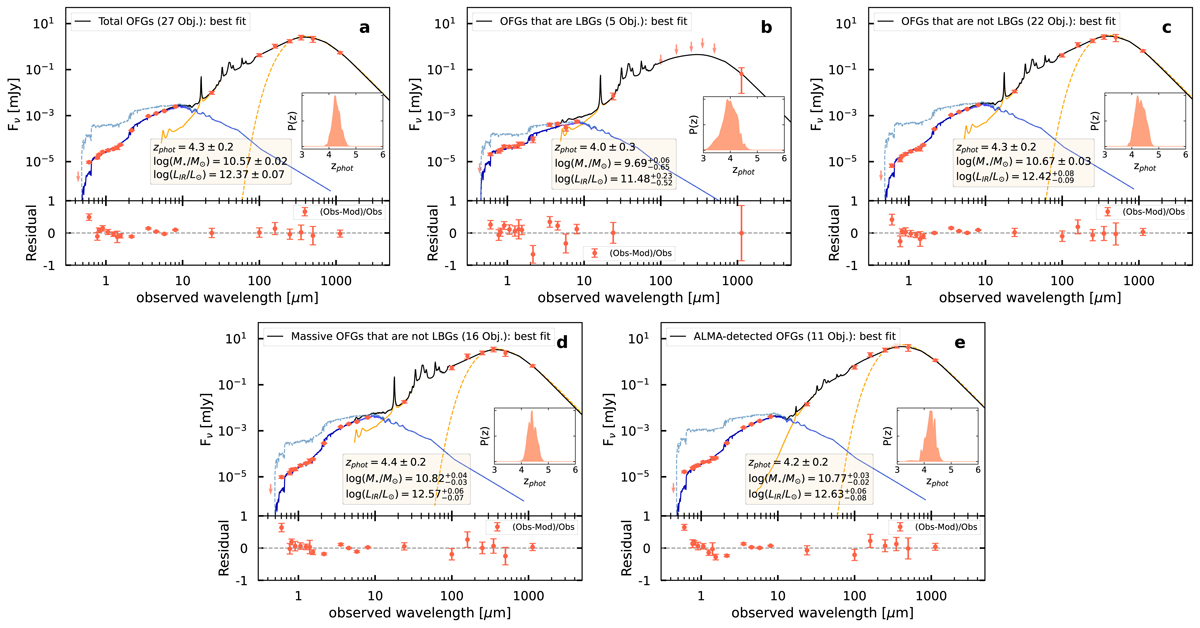
Mean stacked SEDs for the total sample and four sub-samples of our OFGs. Panel a: total sample of 27 OFGs; (b)–(e): sub-samples of OFGs that are LBGs, OFGs that are not LBGs, massive OFGs (log(M⋆/M⊙) > 10.3) that are not LBGs, and OFGs with ALMA detections, respectively. We use the sub-samples in panelc and paneld to calculate the SFRD. Top: best-fit SED of the stacked OFGs (black line), which is composed of the uncorrected dust-attenuated stellar component (dark blue line) and the IR dust contribution (orange solid line). The corrected UV emission is shown as a faint blue line. We also plot the best fit of a MBB (orange dashed line) with a fixed dust emissivity index β = 1.5. We note that there is no significant AGN contribution in our sample, except for the five OFGs that are LBGs displaying the presence of radio AGNs (see Sect. 5.3.2). The measured fluxes (red points) are derived from the stacked images. Error bars (1σ) and upper limits (3σ) are obtained from the Monte Carlo simulation (except Herschel) and bootstrap approach (Herschel; see Sect. 5.2). The inset shows the likelihood distribution of the photometric redshift based on the UV to MIR SED fitting from EAzY (see Sect. 4.1), which is normalized to the peak value. Bottom: residuals calculated from (observation − model)/observation. The SEDs for individual OFGs are given in the appendix (see Figs. C.1 and C.2).
Current usage metrics show cumulative count of Article Views (full-text article views including HTML views, PDF and ePub downloads, according to the available data) and Abstracts Views on Vision4Press platform.
Data correspond to usage on the plateform after 2015. The current usage metrics is available 48-96 hours after online publication and is updated daily on week days.
Initial download of the metrics may take a while.