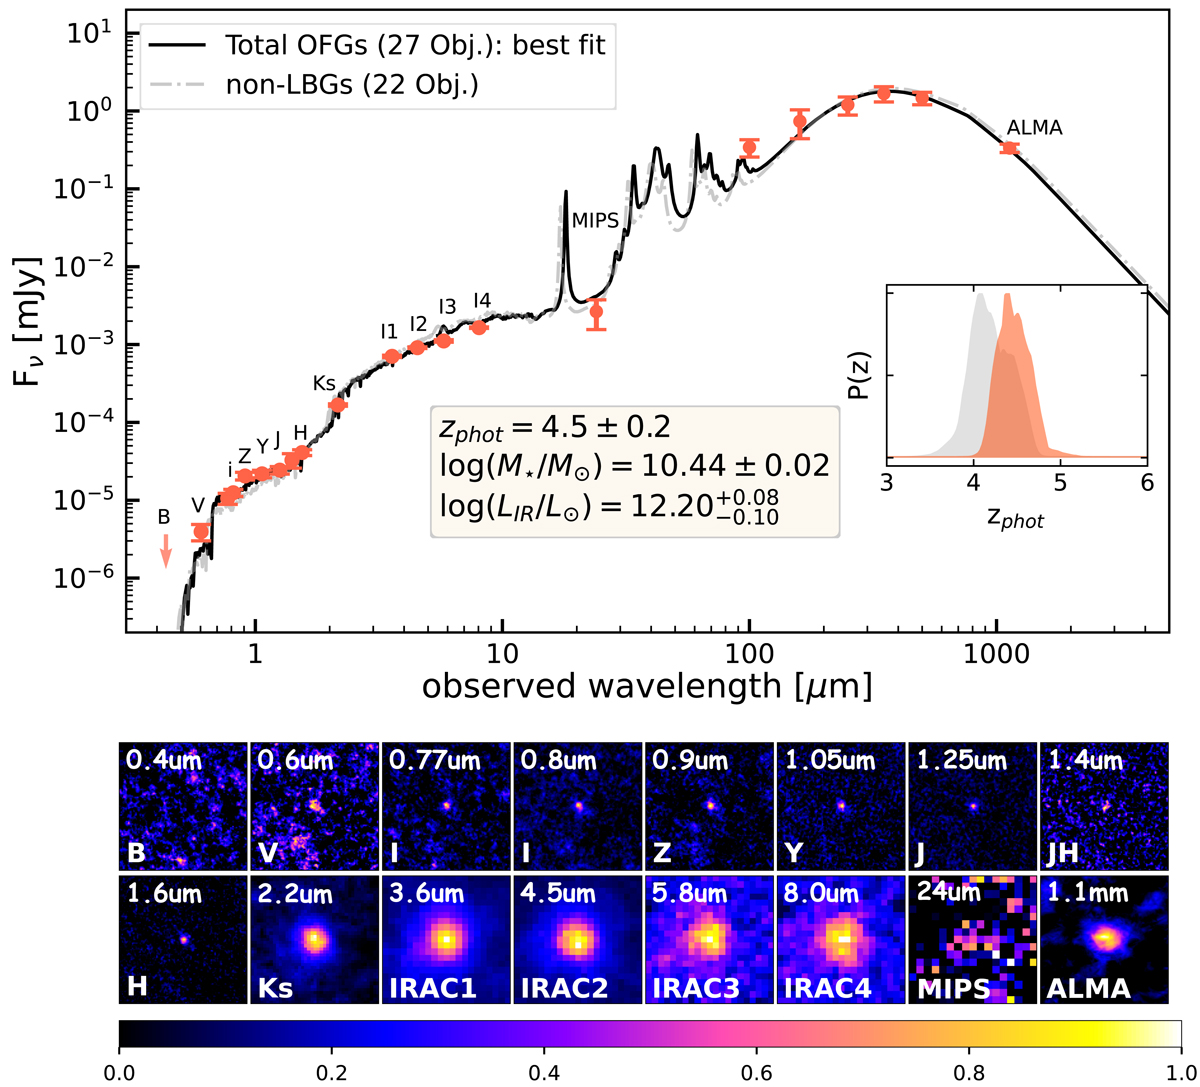
Fig. 6.
Download original image
Median stacked SED and images of the total sample of 27 OFGs in this work. Top: best-fit SED of the total sample (black line). The measured fluxes (red points) are derived from the stacked images. Error bars (1σ) and upper limits (3σ) are obtained from the Monte Carlo simulation (except Herschel) and bootstrap approach (Herschel; see Sect. 5.2). We also show the best-fit SED for 22 non-LBGs (grey line). These 22 non-LBGs will be used to calculate the cosmic SFRD. The inset shows the likelihood distributions of the photometric redshift of our samples (total sample in red, 22 non-LBGs in grey), based on the UV to MIR SED fitting from EAzY, which is normalized to the peak value. The redshift obtained from the maximized likelihood is z ∼ 4.5 for the total 27 OFGs and z ∼ 4.2 for the 22 non-LBGs. Bottom: stacked images of the total sample with peak fluxes normalized. Each panel is 6″ × 6″ except for the MIPS 24 μm, which is 24″ × 24″.
Current usage metrics show cumulative count of Article Views (full-text article views including HTML views, PDF and ePub downloads, according to the available data) and Abstracts Views on Vision4Press platform.
Data correspond to usage on the plateform after 2015. The current usage metrics is available 48-96 hours after online publication and is updated daily on week days.
Initial download of the metrics may take a while.