Fig. 3.
Download original image
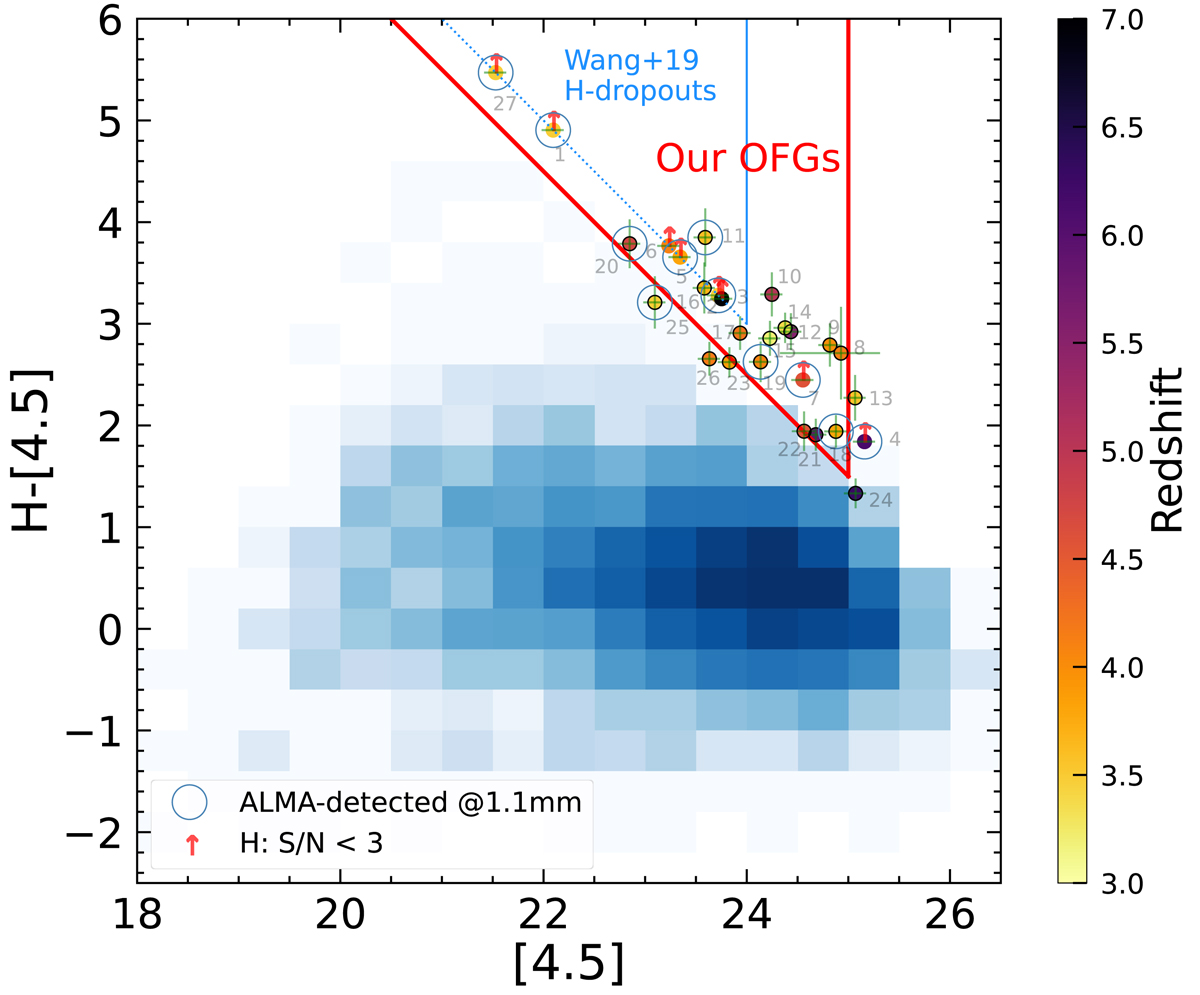
Color-magnitude diagram color-coded by photometric redshift. Our criteria (in red) for selecting OFGs are: H > 26.5 mag & [4.5] < 25 mag. We note that we include sources outside the wedge whose 1σ photometric uncertainties overlap the wedge, so we have points outside the red triangle. The arrows show our H-dropouts (S/N < 3), with the typical depth of H = 27 mag (5σ) in the shallowest region of the HLF survey as their lower limits. The blue shaded area describes the distribution of all the IRAC detected sources (see Appendix A for more details) in the GOODS-ALMA field. The blue and red triangular regions are the same as in Fig. 2.
Current usage metrics show cumulative count of Article Views (full-text article views including HTML views, PDF and ePub downloads, according to the available data) and Abstracts Views on Vision4Press platform.
Data correspond to usage on the plateform after 2015. The current usage metrics is available 48-96 hours after online publication and is updated daily on week days.
Initial download of the metrics may take a while.