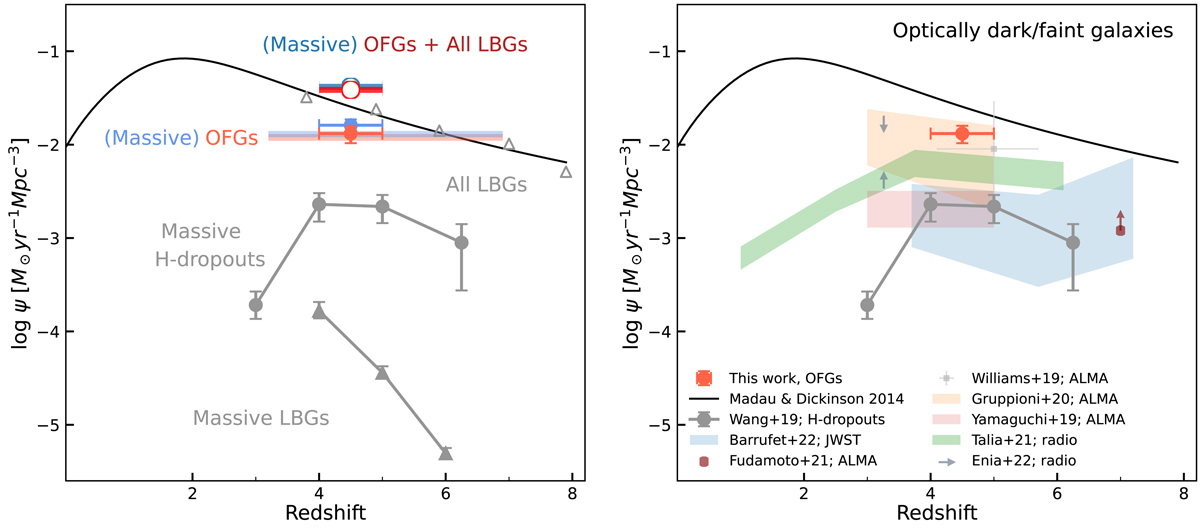
Fig. 11.
Download original image
Cosmic star formation history of the Universe. Left: contribution of our OFGs to the cosmic SFRD. The black line is the cosmic SFRD, ψ, as a function of redshift from Madau & Dickinson (2014), which is based on LBGs at z ≳ 4 with a dust correction applied (grey open triangles; Bouwens et al. 2012a,b). The 22 OFGs that are not LBGs are shaded in red and the 16 massive OFGs that are not LBGs (log(M⋆/M⊙) > 10.3) are shaded in blue, where the sources at z = 4 − 5 are shown in faint red and blue filled circles, respectively. Grey filled circles are ALMA-detected massive H-dropouts with log(M⋆/M⊙) > 10.3 (Wang et al. 2019). Grey filled triangles are massive LBGs with log(M⋆/M⊙) > 10.3 whose SFRD is based on the dust-corrected UV (Wang et al. 2019). We also show the combined contribution of OFGs and LBGs to the cosmic SFRD. The red (blue) open circle indicates the combined contribution of OFGs (massive OFGs) and all LBGs (Madau & Dickinson 2014) at z = 4 − 5. Right: summary of the contribution of optically dark or faint galaxies to the cosmic SFRD from the literature. These optically dark or faint galaxies were selected in different methods, including our OFGs (red point; this work), ALMA-detected massive H-dropouts (grey filled circles; Wang et al. 2019), JWST-selected HST-dark galaxies from CEERS (blue area; Barrufet et al. 2022), ALMA-detected optically dark sources from REBELS (brown point and arrow; Fudamoto et al. 2021), an ALMA-detected NIR-dark galaxy in COSMOS (light grey point; Williams et al. 2019), ALMA-detected HST+near-IR dark galaxies from ALPINE (orange area; Gruppioni et al. 2020), ALMA-detected K-dropouts from ASAGAO (red area; Yamaguchi et al. 2019), radio 3 GHz-selected UV-dark galaxies in COSMOS (green area; Talia et al. 2021), and radio 1.4 GHz-selected HST-dark galaxies in GOODS-N (grey arrows; Enia et al. 2022). All data from the literature have been converted to a Chabrier (2003) IMF.
Current usage metrics show cumulative count of Article Views (full-text article views including HTML views, PDF and ePub downloads, according to the available data) and Abstracts Views on Vision4Press platform.
Data correspond to usage on the plateform after 2015. The current usage metrics is available 48-96 hours after online publication and is updated daily on week days.
Initial download of the metrics may take a while.