Fig. 10.
Download original image
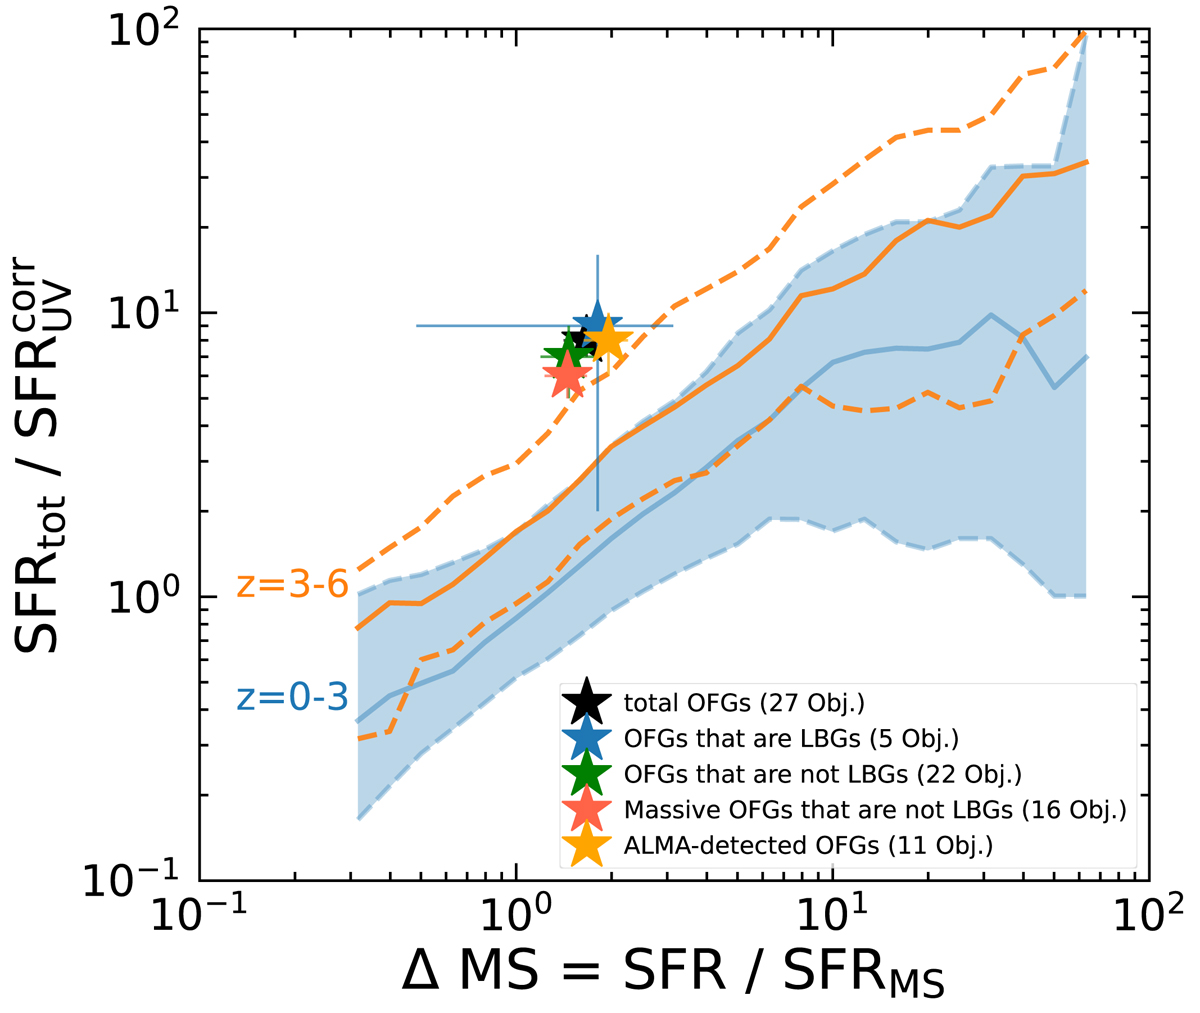
Ratio of the total SFR (SFRtot = SFRIR + SFRUV) and the SFRUV corrected for the dust extinction (SFR![]() ) as a function of the starburstiness (ΔMS = SFRtot/SFRMS). Stars represent the mean stacked OFG (sub)samples as in Fig. 8. The solid and dashed lines show the sliding median and 16–84th percentile range of star-forming galaxies from the CDF-S field with a Herschel detection at 0 ≤ z ≤ 3 (blue) and 3 ≤ z ≤ 6 (orange) from the ZFOURGE catalog (Straatman et al. 2016).
) as a function of the starburstiness (ΔMS = SFRtot/SFRMS). Stars represent the mean stacked OFG (sub)samples as in Fig. 8. The solid and dashed lines show the sliding median and 16–84th percentile range of star-forming galaxies from the CDF-S field with a Herschel detection at 0 ≤ z ≤ 3 (blue) and 3 ≤ z ≤ 6 (orange) from the ZFOURGE catalog (Straatman et al. 2016).
Current usage metrics show cumulative count of Article Views (full-text article views including HTML views, PDF and ePub downloads, according to the available data) and Abstracts Views on Vision4Press platform.
Data correspond to usage on the plateform after 2015. The current usage metrics is available 48-96 hours after online publication and is updated daily on week days.
Initial download of the metrics may take a while.