Fig. 5
Download original image
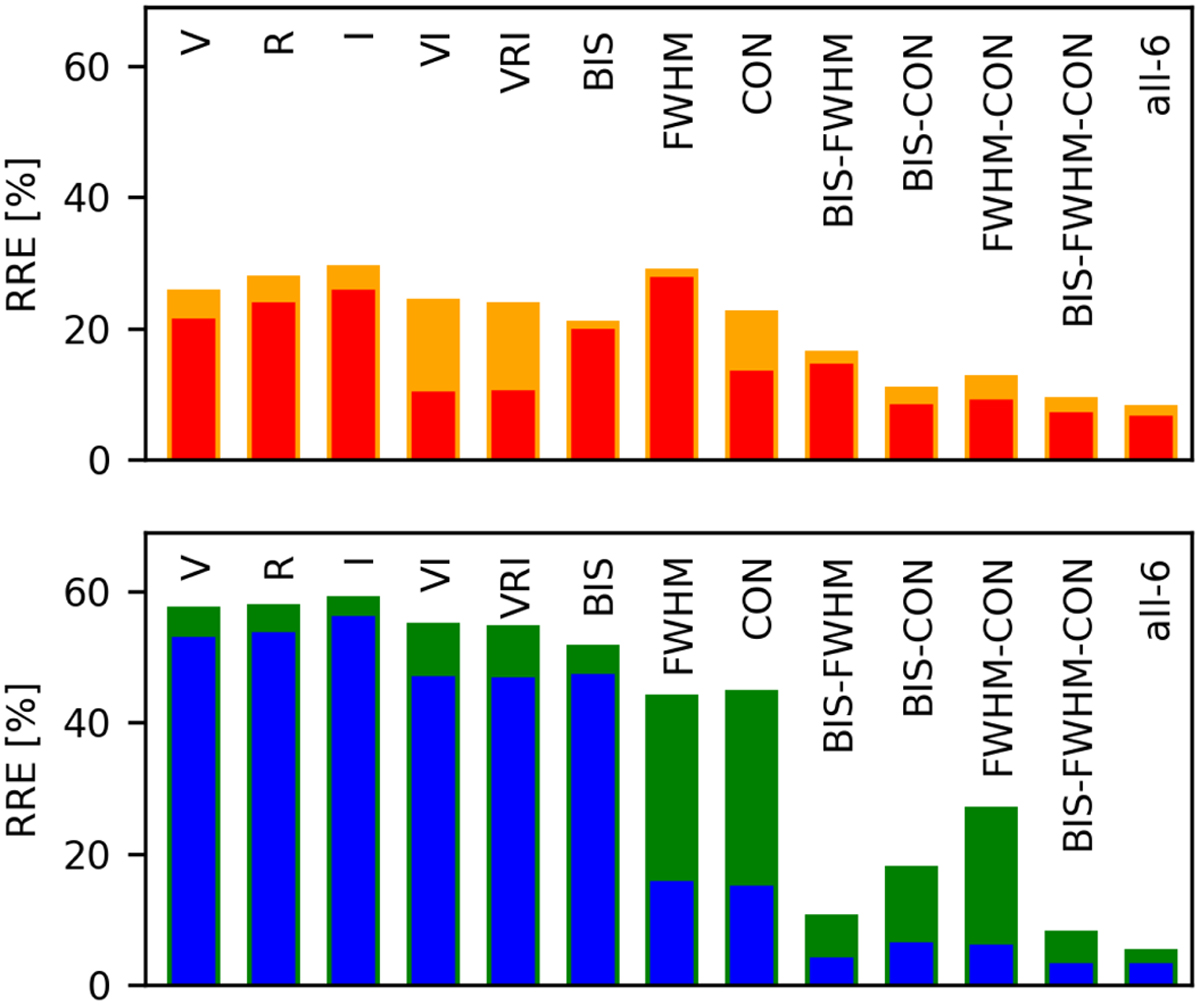
RRE after the application of the trained NNs on the 540 000 and 900 000 starsim models in percentage for ε Eri (top) and AU Mic (bottom), respectively. We mark the different activity-index combinations used for the NN training. The average RV reduction for the different time samplings average is given for ε Eri in red and for AU Mic in blue. The yellow and green bars indicate the value, if the relative additional error from Table 2 was added to the input data.
Current usage metrics show cumulative count of Article Views (full-text article views including HTML views, PDF and ePub downloads, according to the available data) and Abstracts Views on Vision4Press platform.
Data correspond to usage on the plateform after 2015. The current usage metrics is available 48-96 hours after online publication and is updated daily on week days.
Initial download of the metrics may take a while.