Fig. A.1
Download original image
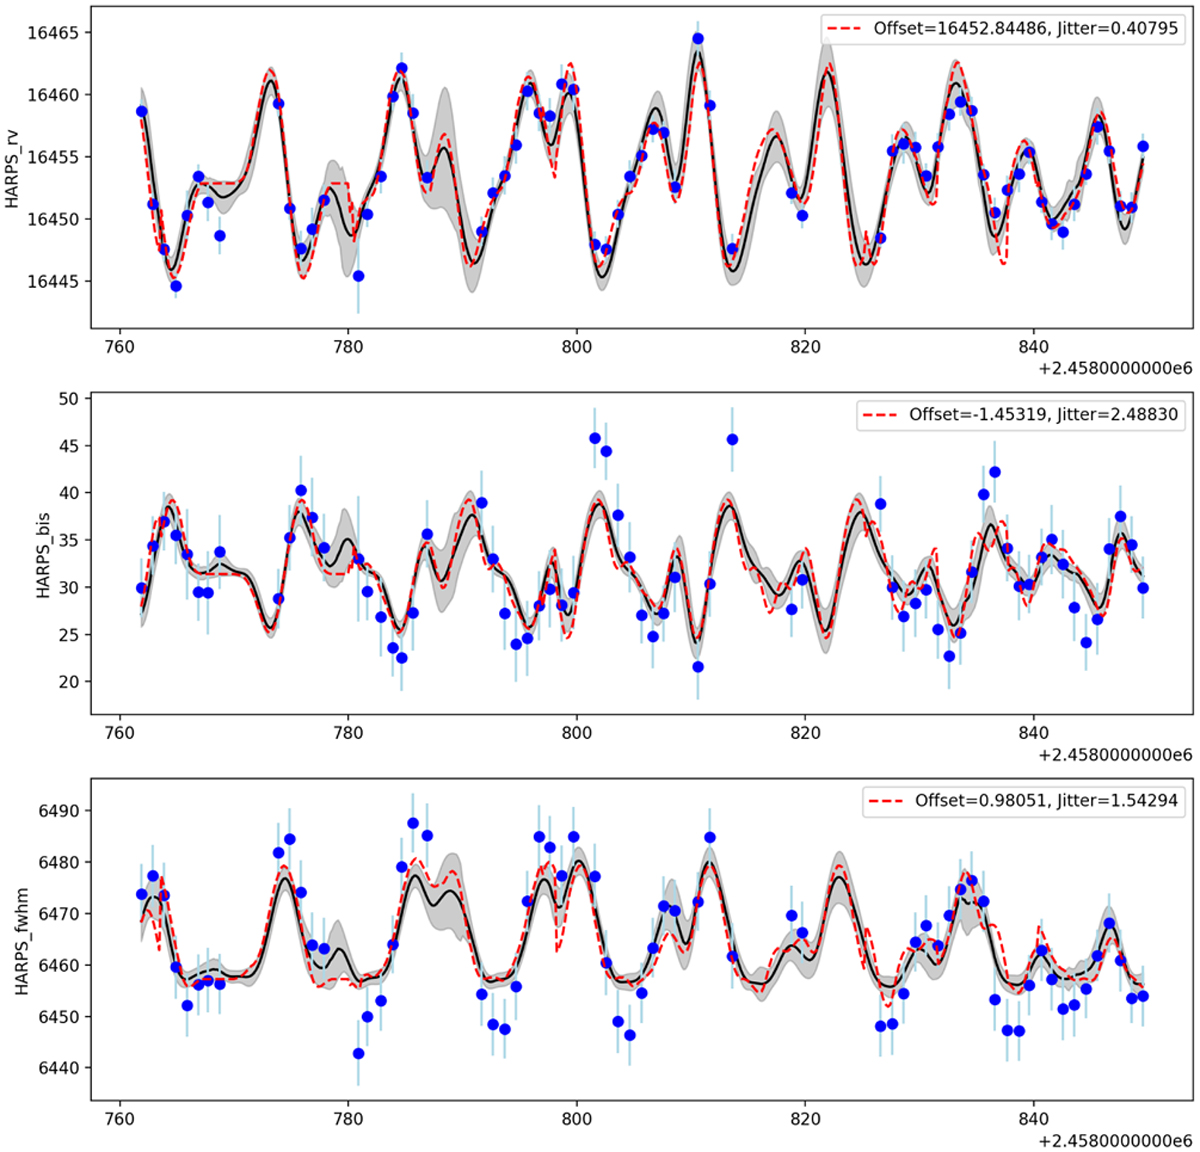
Results of the starsim inversions for ε Eri using RV (top panel), FWHM (middle panel), and BIS (bottom panel). Blue dots indicate the measurements as extracted from raccoon from the observed spectra. The black curve shows the average fit and the grey area the uncertainty of the different solutions. The dashed red curve shows the solution with the largest likelihood. On the top right, the offset for each time series is indicated as well as its additional jitter, both of which show the shortcomings of the modelling of time-series data with starsim.
Current usage metrics show cumulative count of Article Views (full-text article views including HTML views, PDF and ePub downloads, according to the available data) and Abstracts Views on Vision4Press platform.
Data correspond to usage on the plateform after 2015. The current usage metrics is available 48-96 hours after online publication and is updated daily on week days.
Initial download of the metrics may take a while.