Fig. 10
Download original image
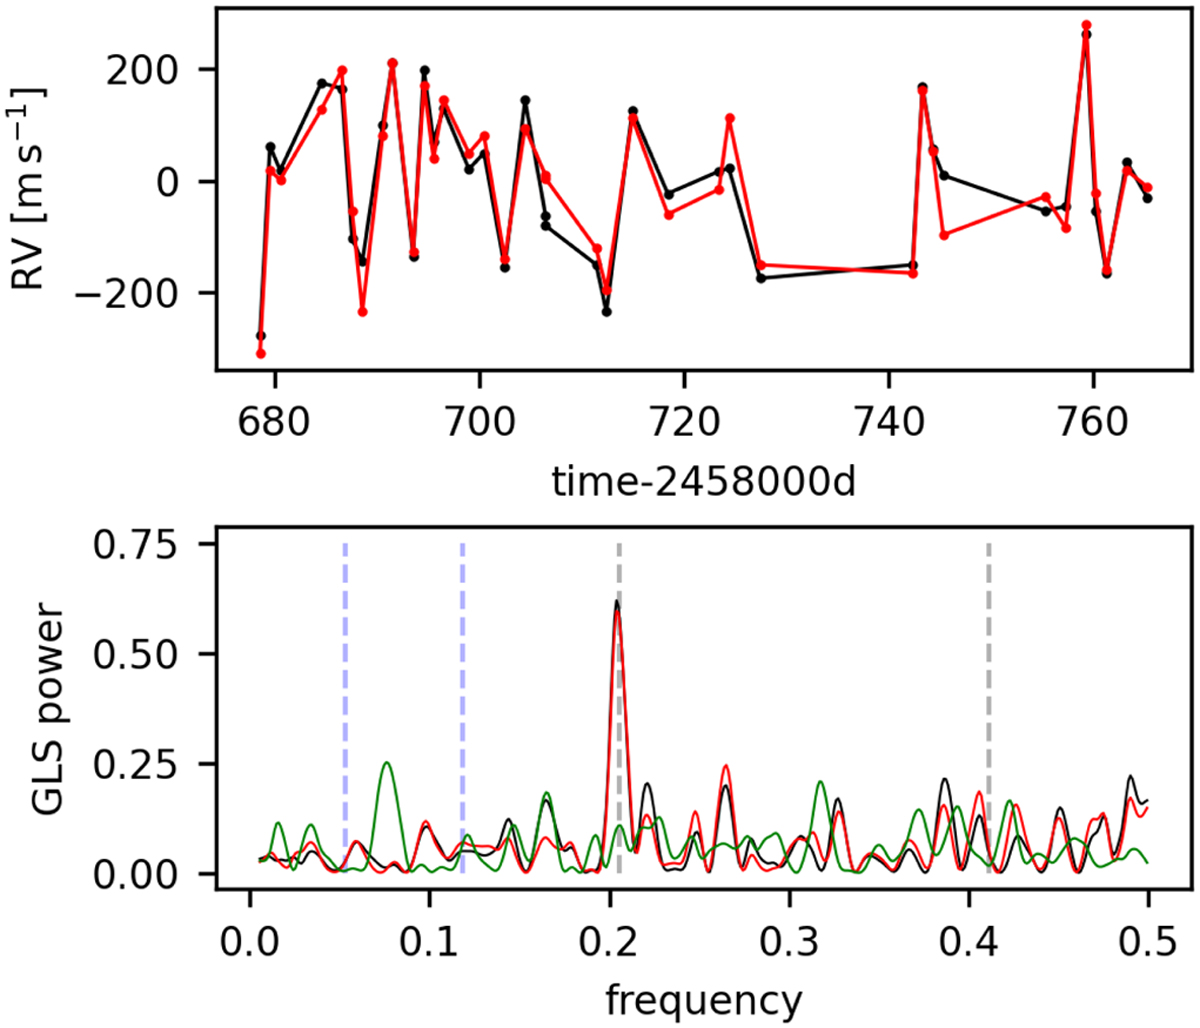
Results for the AU Mic observations. Top panel: RVs from AU Mic as observed (black) and as modelled by the trained NN using BIS, and FWHM indices with their respective RREs. Bottom panel: periodogram of the observed RVs (black), the NN output (red), and the difference (green). Dashed black lines indicate the rotation period and its second harmonic, and dashed blue lines indicate the orbits of the two planetary companions of AU Mic. We reach RREs as low as 10%.
Current usage metrics show cumulative count of Article Views (full-text article views including HTML views, PDF and ePub downloads, according to the available data) and Abstracts Views on Vision4Press platform.
Data correspond to usage on the plateform after 2015. The current usage metrics is available 48-96 hours after online publication and is updated daily on week days.
Initial download of the metrics may take a while.