Fig. 1
Download original image
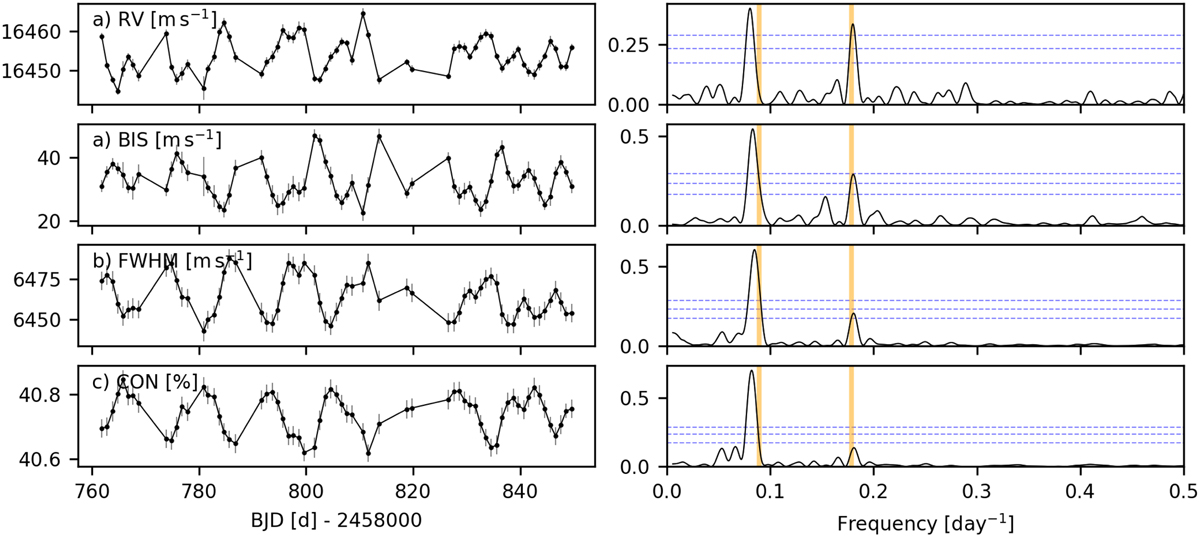
Nightly binned time series (left panels) and their periodograms (right panels) of ε Eri extracted with raccoon. From top to bottom they are RV, BIS, FWHM, and CON. Dashed blue horizontal lines indicate FAP levels of 0.1, 1, and 10%, and the vertical orange lines indicate the frequency of the rotation period of 11.2 days and its second harmonic.
Current usage metrics show cumulative count of Article Views (full-text article views including HTML views, PDF and ePub downloads, according to the available data) and Abstracts Views on Vision4Press platform.
Data correspond to usage on the plateform after 2015. The current usage metrics is available 48-96 hours after online publication and is updated daily on week days.
Initial download of the metrics may take a while.