Open Access
Fig. 8
Download original image
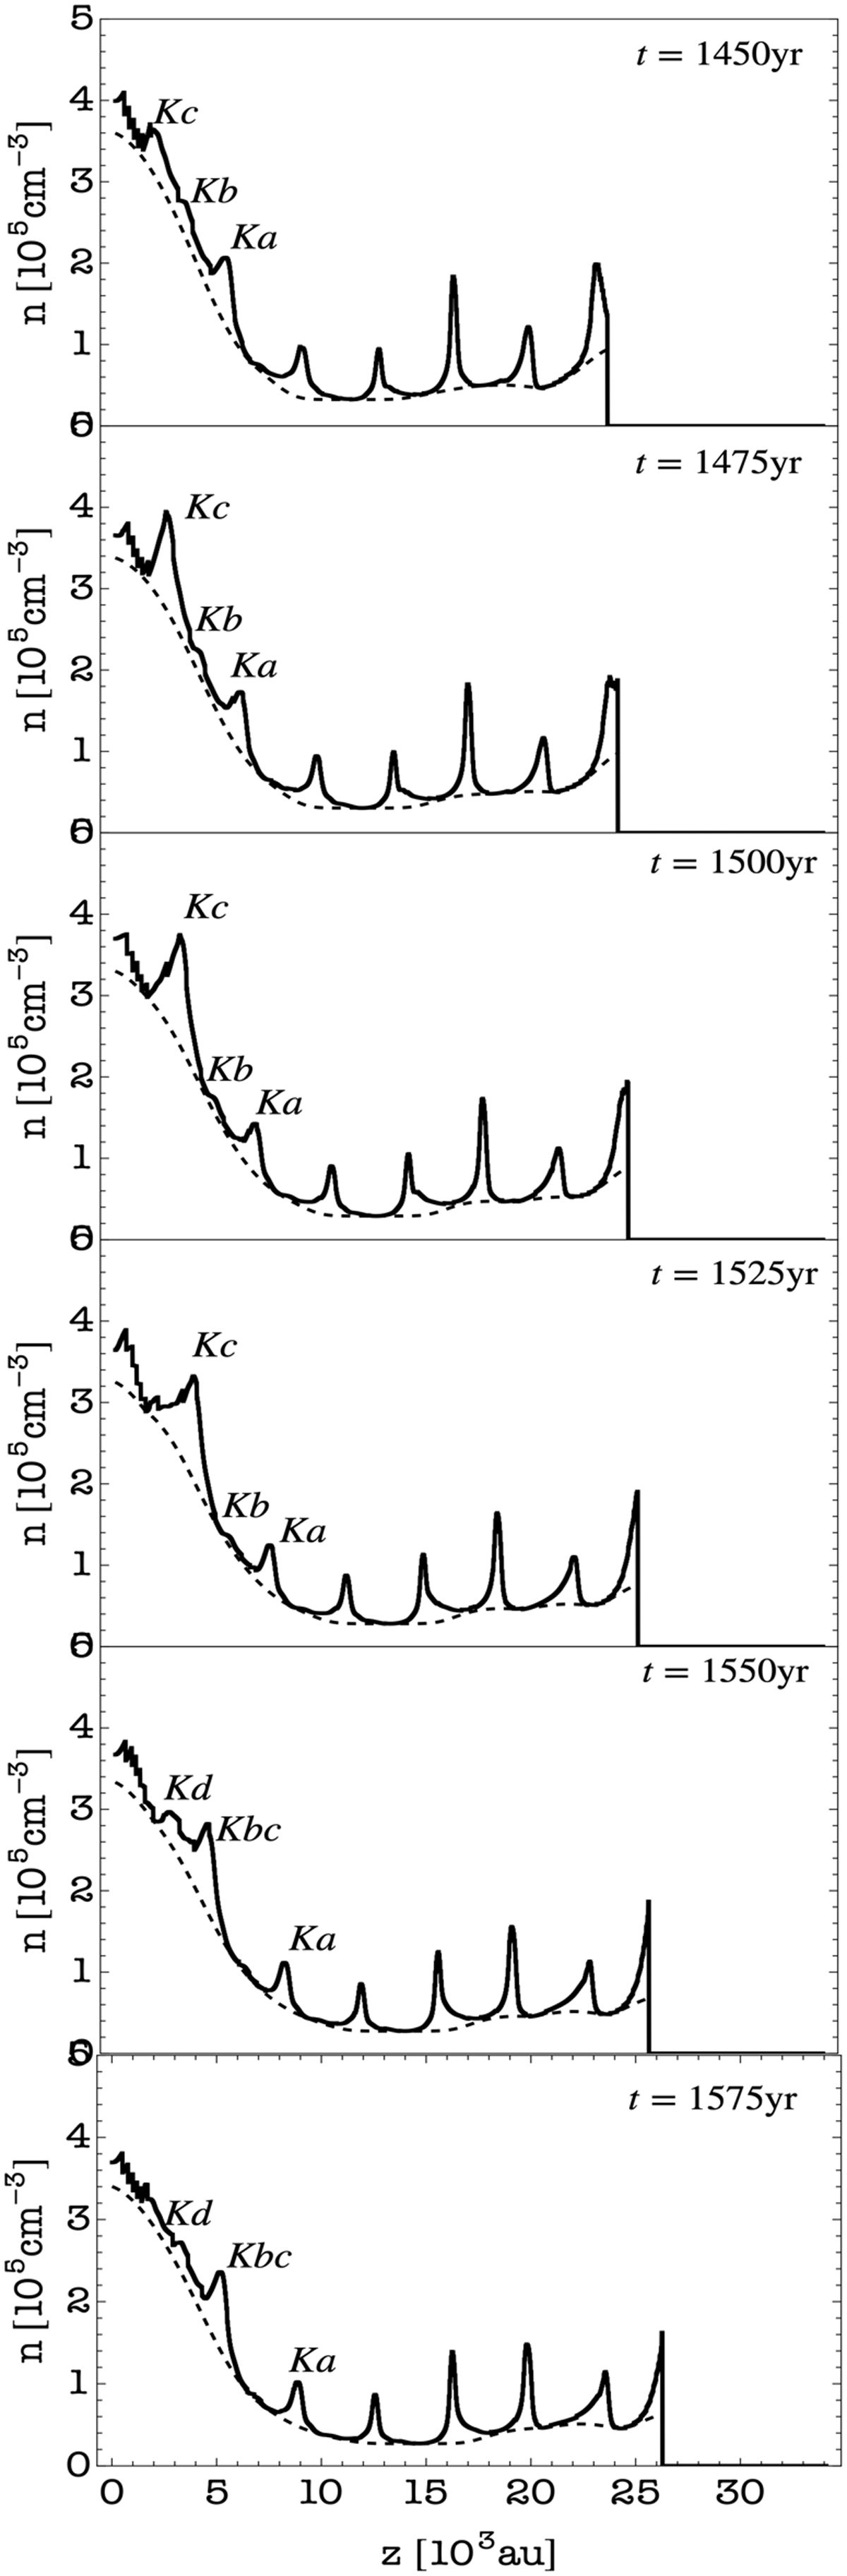
Gas density distribution along the jet main axis for different snapshots from 1450 to 1575 yr (dashed lines). Knots can be identified as overdensities in the density distribution (thick lines) in the order of 105 c−3. To follow their behavior some knots have been labeled as Ka. Kb, Kc and Kd.
Current usage metrics show cumulative count of Article Views (full-text article views including HTML views, PDF and ePub downloads, according to the available data) and Abstracts Views on Vision4Press platform.
Data correspond to usage on the plateform after 2015. The current usage metrics is available 48-96 hours after online publication and is updated daily on week days.
Initial download of the metrics may take a while.