Open Access
Fig. 5
Download original image
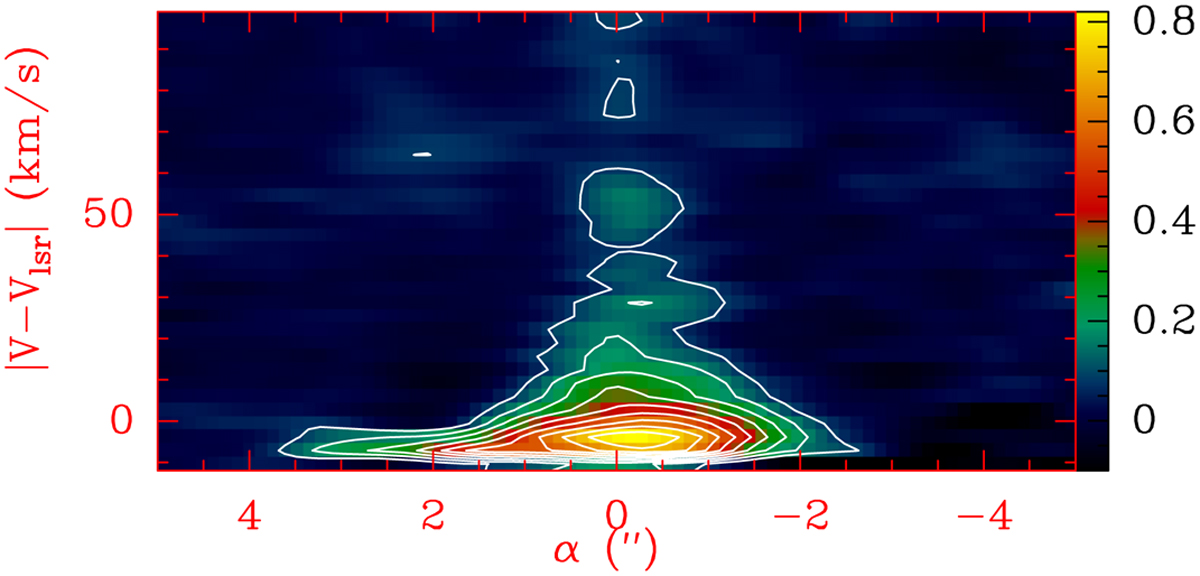
Cep E northern outflow lobe. Position-Velocity diagram of the CO J = 2−1 line emission across the jet main axis at δ = 0″.Positions are in arcsec offset relative to the location of the driving protostar CepE-A. First contour and contour interval are 10% of the peak intensity (Schutzer et al. 2022).
Current usage metrics show cumulative count of Article Views (full-text article views including HTML views, PDF and ePub downloads, according to the available data) and Abstracts Views on Vision4Press platform.
Data correspond to usage on the plateform after 2015. The current usage metrics is available 48-96 hours after online publication and is updated daily on week days.
Initial download of the metrics may take a while.