Fig. 11
Download original image
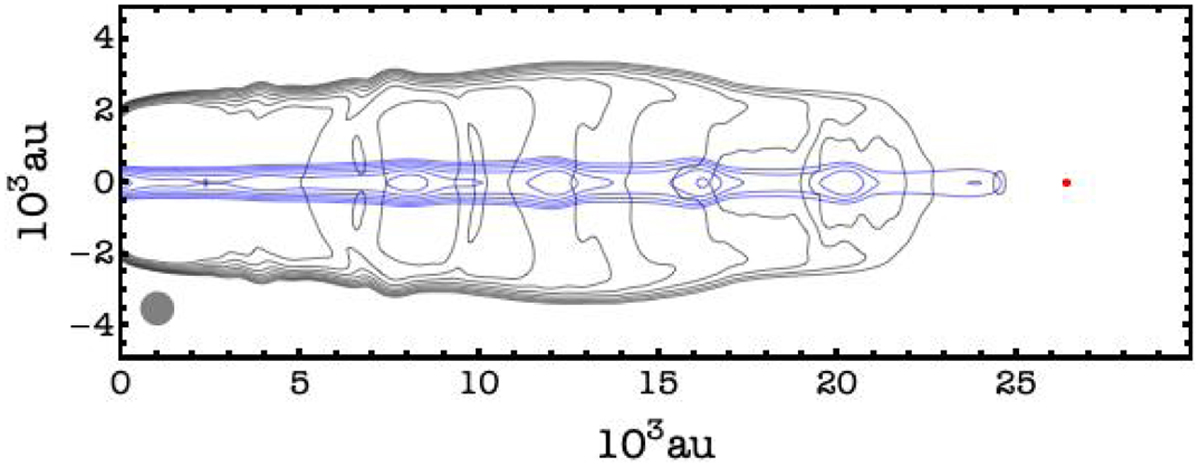
Synthetic map of Model Ml at t = 1500 yr considering a projection angle with respect to the plane of the sky of 47°, as observed in Cep E-mm. CO J = 2-1 integrated emissivity contour maps of the cavity (Black contours, 3–7 km s−1) and the jet (Blue contours, 50–150 km s−1) components. Scaling is logarithmic. The response of the IRAM interferometer was modeled by a Gaussian of 830 au diameter (FWHM), corresponding to a beam size of 1″ (FWHP) at the distance of Cep E-mm, which is drawn with a gray disk (bottom left). The location of the frontal shock is marked with a red point.
Current usage metrics show cumulative count of Article Views (full-text article views including HTML views, PDF and ePub downloads, according to the available data) and Abstracts Views on Vision4Press platform.
Data correspond to usage on the plateform after 2015. The current usage metrics is available 48-96 hours after online publication and is updated daily on week days.
Initial download of the metrics may take a while.