Fig. 9.
Download original image
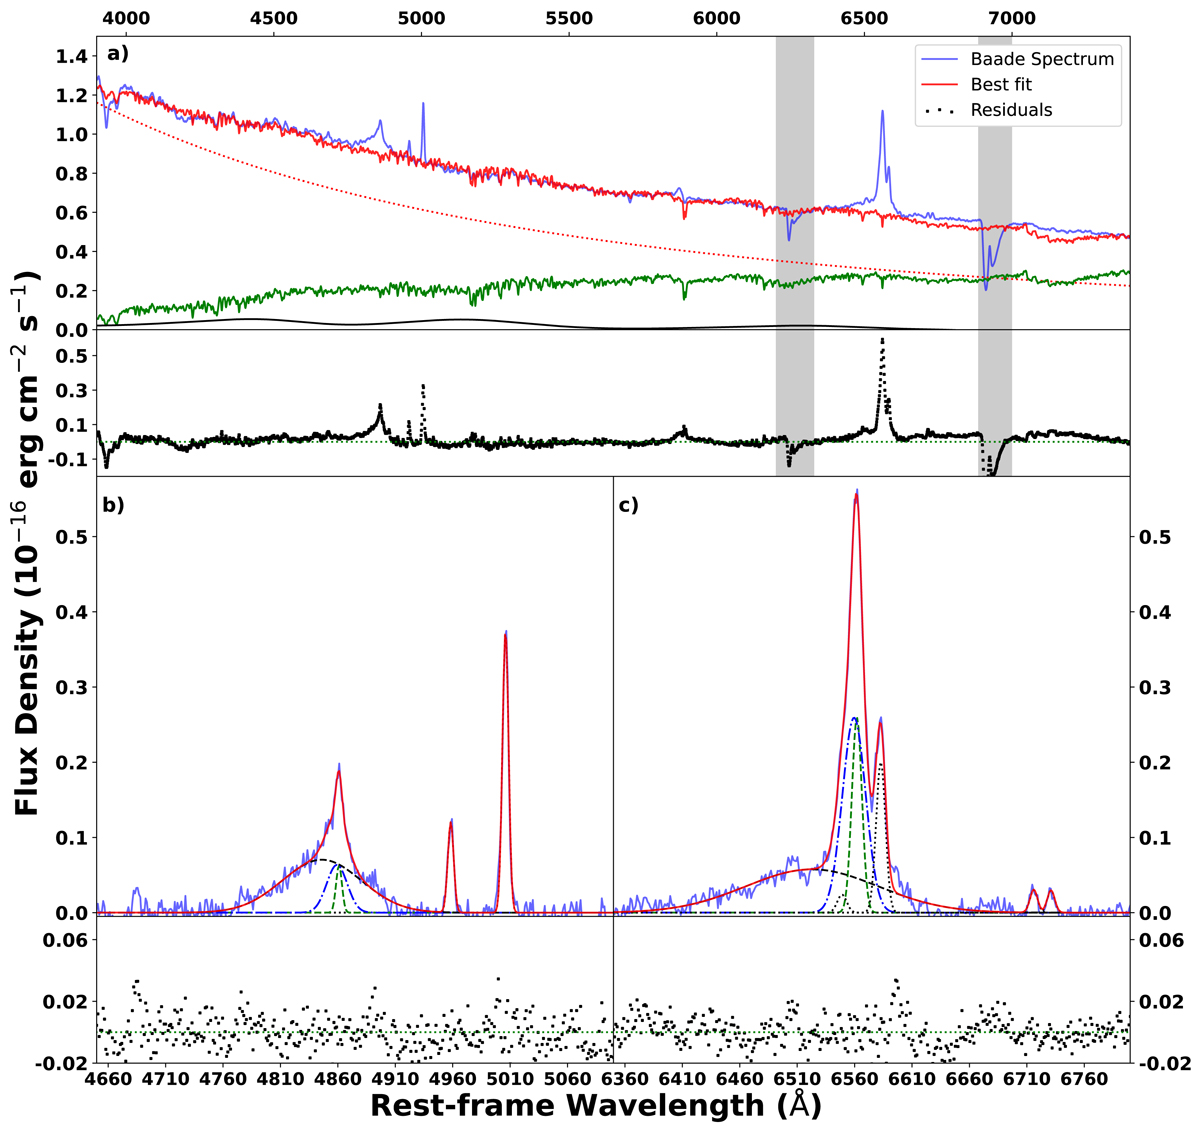
Our fitting procedure for the optical spectra. The procedure is illustrated for the spectrum taken with the Baade telescope on MJD 59195. (a) Continuum fit. The continuum is fit with a function consisting of a single power law (red dotted), an FeII-emission template (black), and a host-galaxy template (green). The residuals for all fits are shown underneath their respective plots. (b) Fit of continuum-subtracted spectrum around Hβ. The combined fit consists of five Gaussian profiles, two for the narrow [OIII] (black dotted) lines and a narrow (green dashed), broad (blue dot-dashed), and very broad (black dashed) component for Hβ. (c) Fit of continuum-subtracted spectrum around Hα. The combined fit for this region consists of six Gaussians: two for the narrow [NII] lines, two for the narrow [SII] lines (dotted black), and three for the Hα emission, with the same colours as the components used to fit Hβ.
Current usage metrics show cumulative count of Article Views (full-text article views including HTML views, PDF and ePub downloads, according to the available data) and Abstracts Views on Vision4Press platform.
Data correspond to usage on the plateform after 2015. The current usage metrics is available 48-96 hours after online publication and is updated daily on week days.
Initial download of the metrics may take a while.