Fig. 7.
Download original image
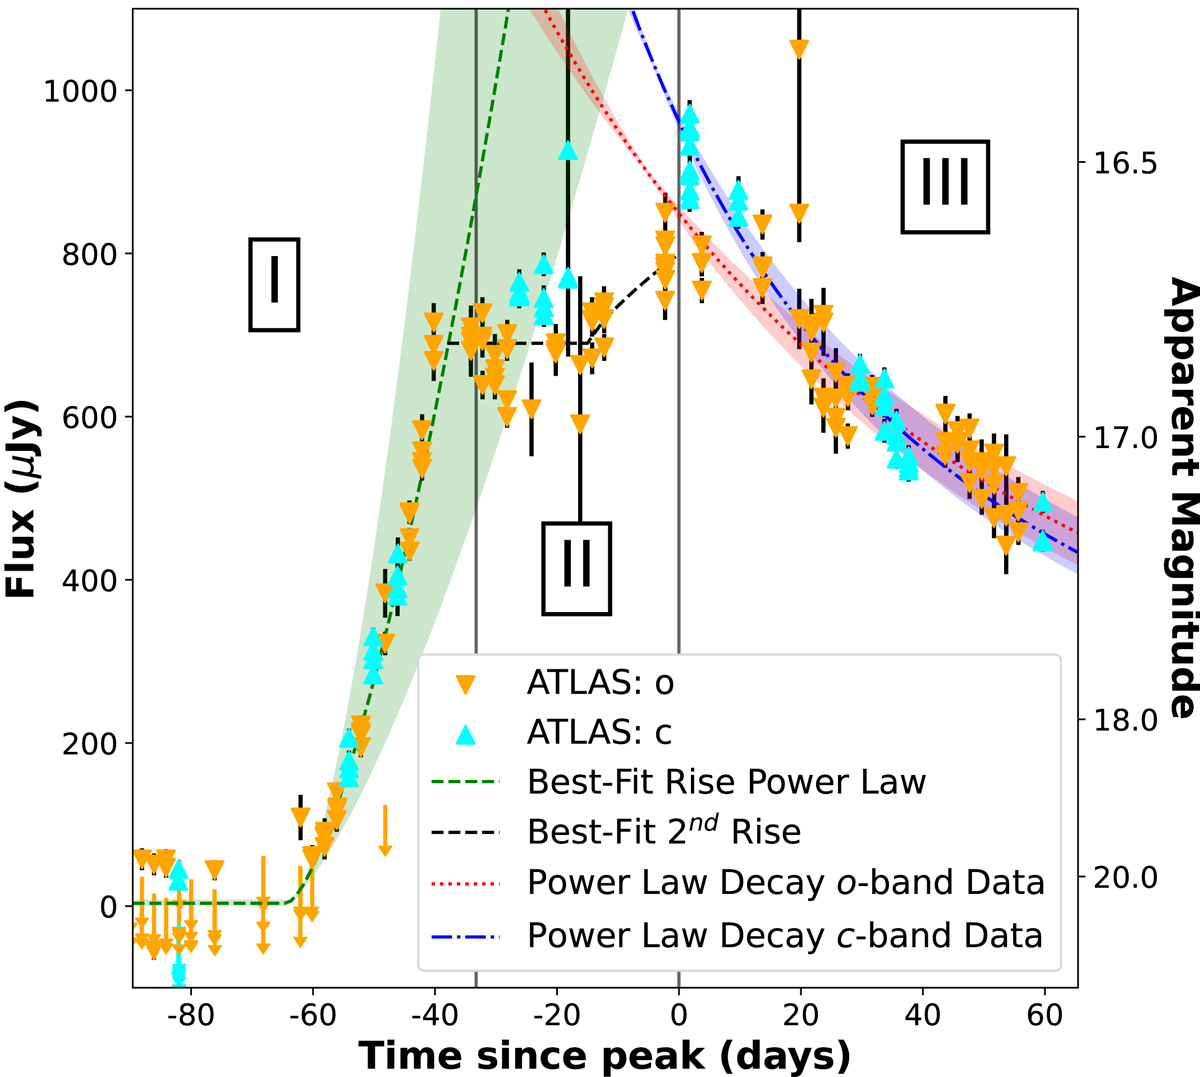
Evolution of optical output in ATLAS o-band and c-band filters. The data are ATLAS differential photometry and the view focuses on the time around the ignition event. All data points include statistical errors. We distinguish three phases in the first months of the ignition event’s light curve: a sharp initial rise, a temporary levelling off & re-brightening, and decay. The demarcations between the phases are shown as grey vertical lines. We compare the data in these three phases with simple power-law models (Eqs. (1) and (2)). The initial rise is fit to the o-band data only and the result is shown in dashed green, with 1σ error margins shown as shaded regions. We include the best-fit rising power-law in phase II (dashed black) primarily to guide the eye, as the light curve data proved to sparse for a well-constrained fit. For the decay period, we separately fit the o-band and the c-band data, and results are shown as the red (dotted) and blue (dot-dashed) lines, respectively.
Current usage metrics show cumulative count of Article Views (full-text article views including HTML views, PDF and ePub downloads, according to the available data) and Abstracts Views on Vision4Press platform.
Data correspond to usage on the plateform after 2015. The current usage metrics is available 48-96 hours after online publication and is updated daily on week days.
Initial download of the metrics may take a while.