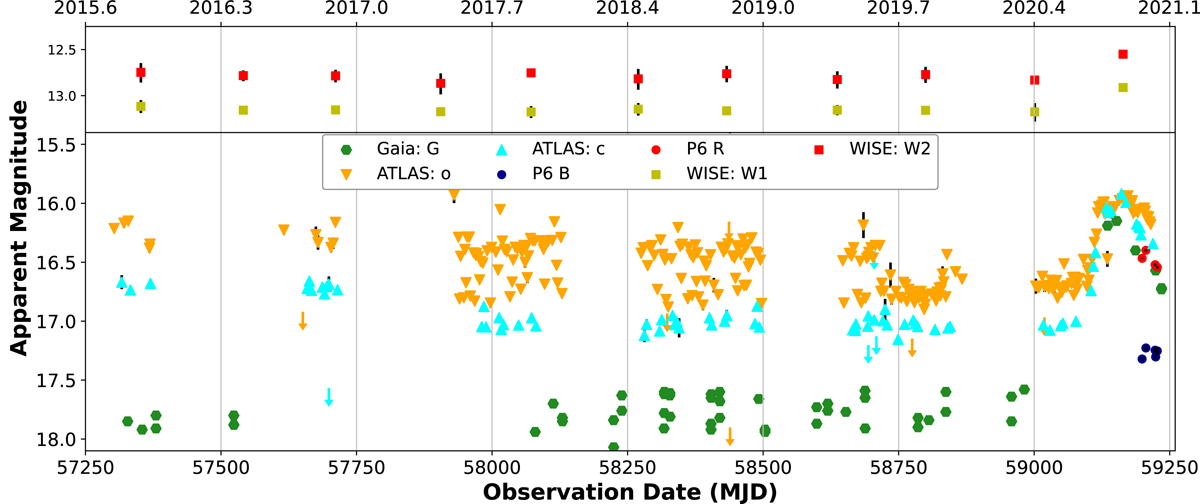
Fig. 6.
Download original image
Optical and infrared photometric data on J234402 over the past five years. The top panel show the NEOWISE-R data for the W1 and W2 infrared bands and the bottom panel shows the optical light curve based on a combination of public survey data and follow-up observations obtained by our team. All measurements have been corrected for Galactic extinction. The optical light curve shows a relatively quiescent state interrupted by a sharp flare, followed by a plateau and subsequent decay. The data are not host subtracted. The downward arrows represent 3σ upper limits in the ATLAS dataset. All data include statistical uncertainties. For most points on our dataset, the statistical uncertainties are too small to be visible in this plot.
Current usage metrics show cumulative count of Article Views (full-text article views including HTML views, PDF and ePub downloads, according to the available data) and Abstracts Views on Vision4Press platform.
Data correspond to usage on the plateform after 2015. The current usage metrics is available 48-96 hours after online publication and is updated daily on week days.
Initial download of the metrics may take a while.