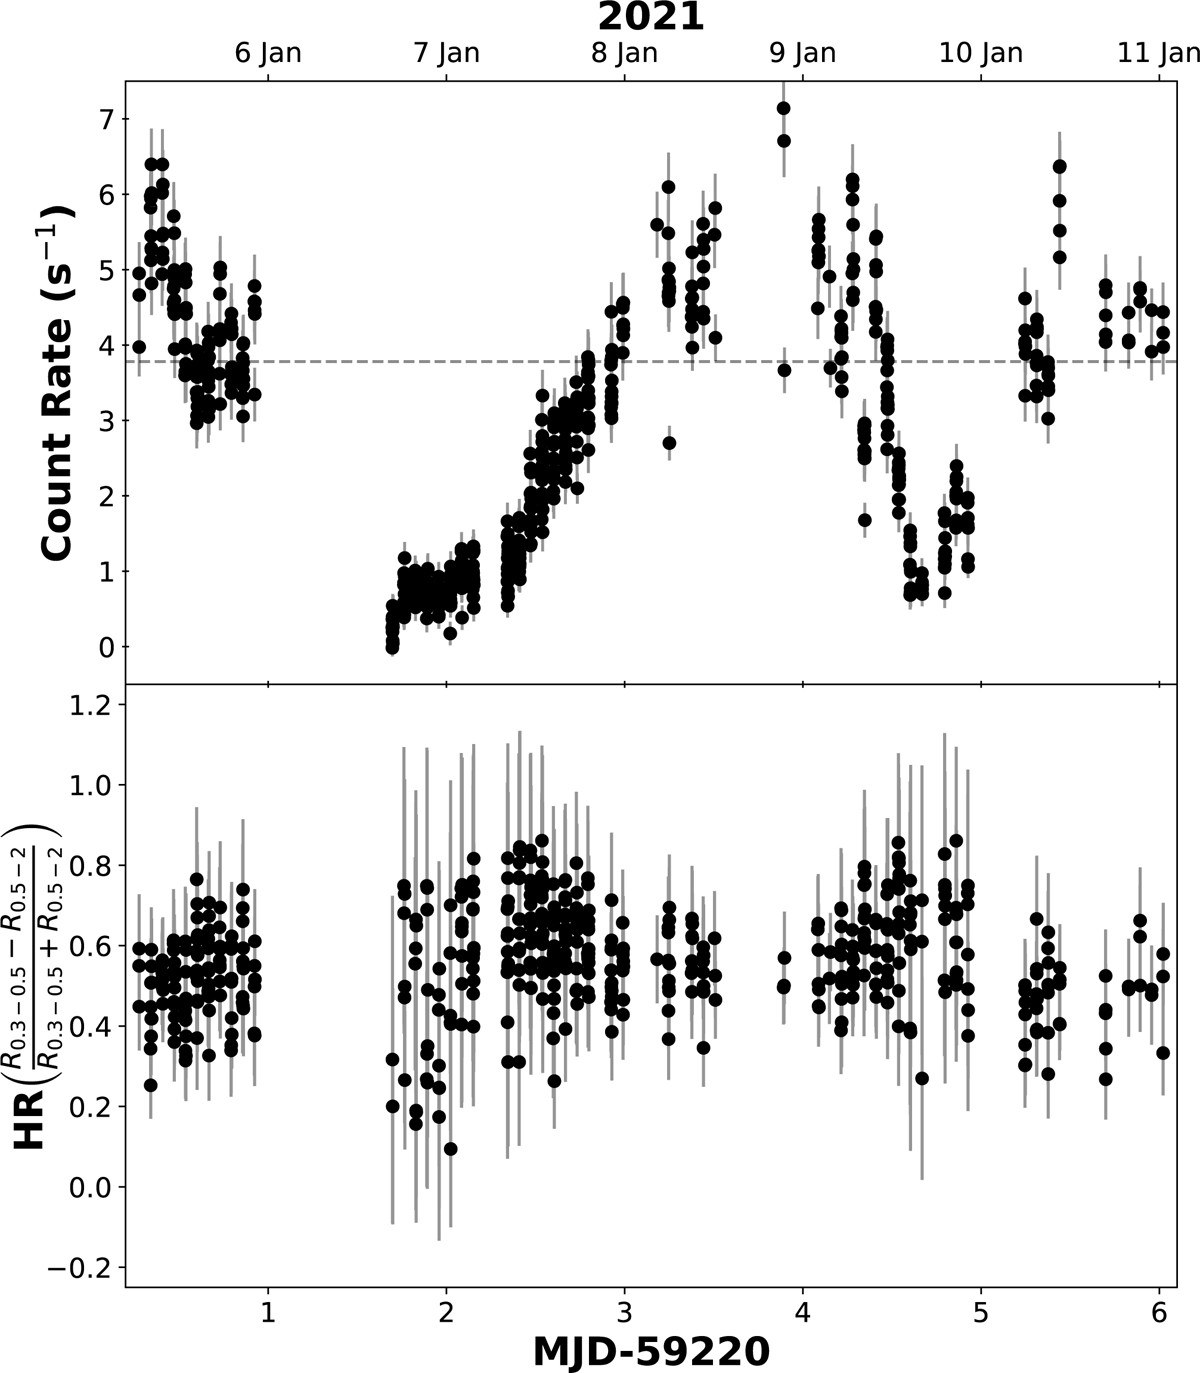
Fig. 4.
Download original image
NICER light curve and hardness ratio of J234402. Top: 0.3–2 keV NICER light curve. The light curve shows significant variability on a timescale of days. The sharp turns up and down are consistent with the rapid variability observed in the XMM-Newton and eROSITA data. The dashed line indicates the cut-off between the low-state and high-state intervals at 3.78 counts s−1, as discussed in Sect. 2.4.2. Bottom: hardness ratio (HR) in NICER light curve. We define the HR using the 0.3–0.5 keV and the 0.5–2 keV count rates (R0.3 − 0.5 and R0.5 − 2, respectively), as defined in the text. We detect no significant change over time.
Current usage metrics show cumulative count of Article Views (full-text article views including HTML views, PDF and ePub downloads, according to the available data) and Abstracts Views on Vision4Press platform.
Data correspond to usage on the plateform after 2015. The current usage metrics is available 48-96 hours after online publication and is updated daily on week days.
Initial download of the metrics may take a while.