Fig. 3.
Download original image
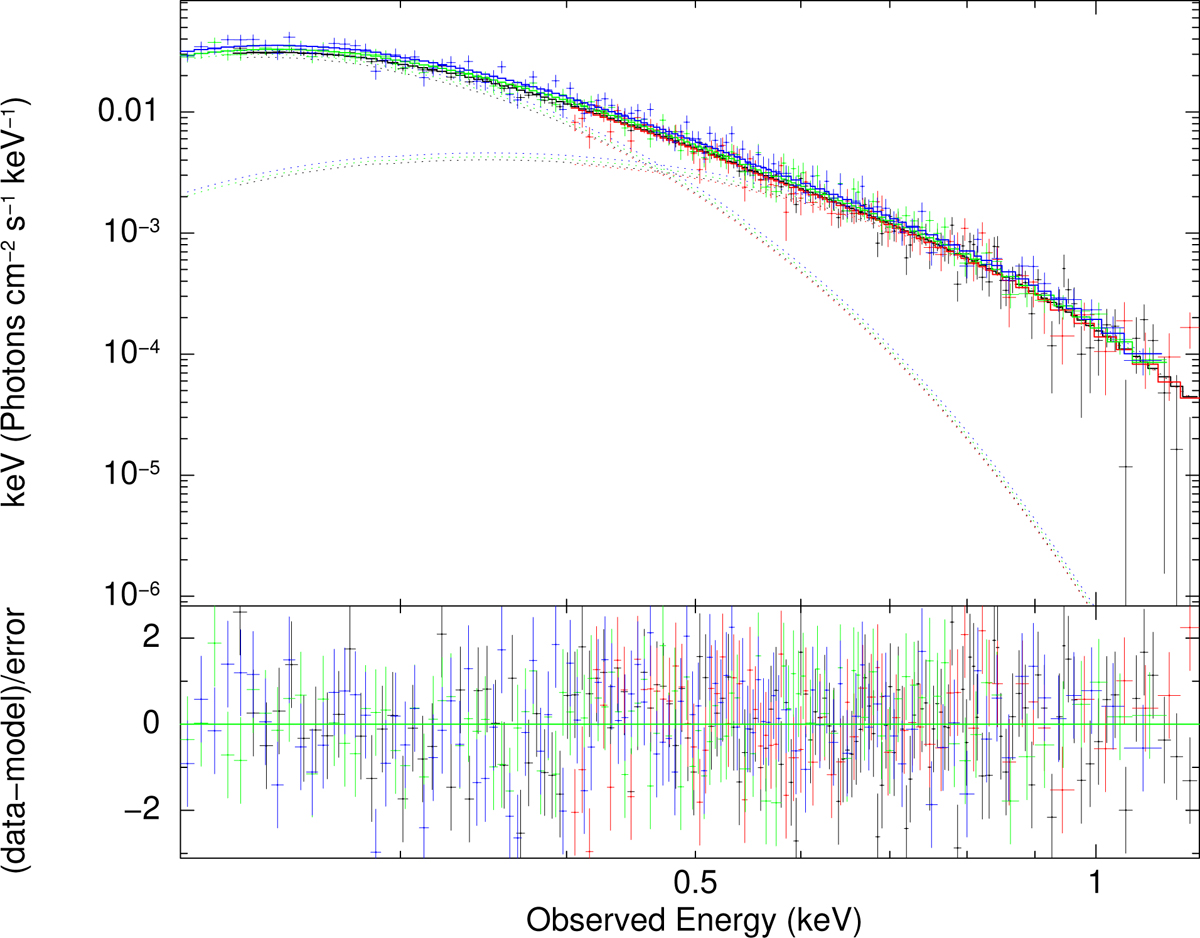
Unfolded model spectrum from XMM-Newton. The spectrum was unfolded using the best-fit dual blackbody model (2BB), with blackbody temperatures of 53 ± 2 eV and ![]() eV. The two blackbody components blend into one another, matching the soft and featureless X-ray spectrum. Black, red, green, and blue points denote pn0, pn14, MOS1, and MOS2 data, respectively.
eV. The two blackbody components blend into one another, matching the soft and featureless X-ray spectrum. Black, red, green, and blue points denote pn0, pn14, MOS1, and MOS2 data, respectively.
Current usage metrics show cumulative count of Article Views (full-text article views including HTML views, PDF and ePub downloads, according to the available data) and Abstracts Views on Vision4Press platform.
Data correspond to usage on the plateform after 2015. The current usage metrics is available 48-96 hours after online publication and is updated daily on week days.
Initial download of the metrics may take a while.