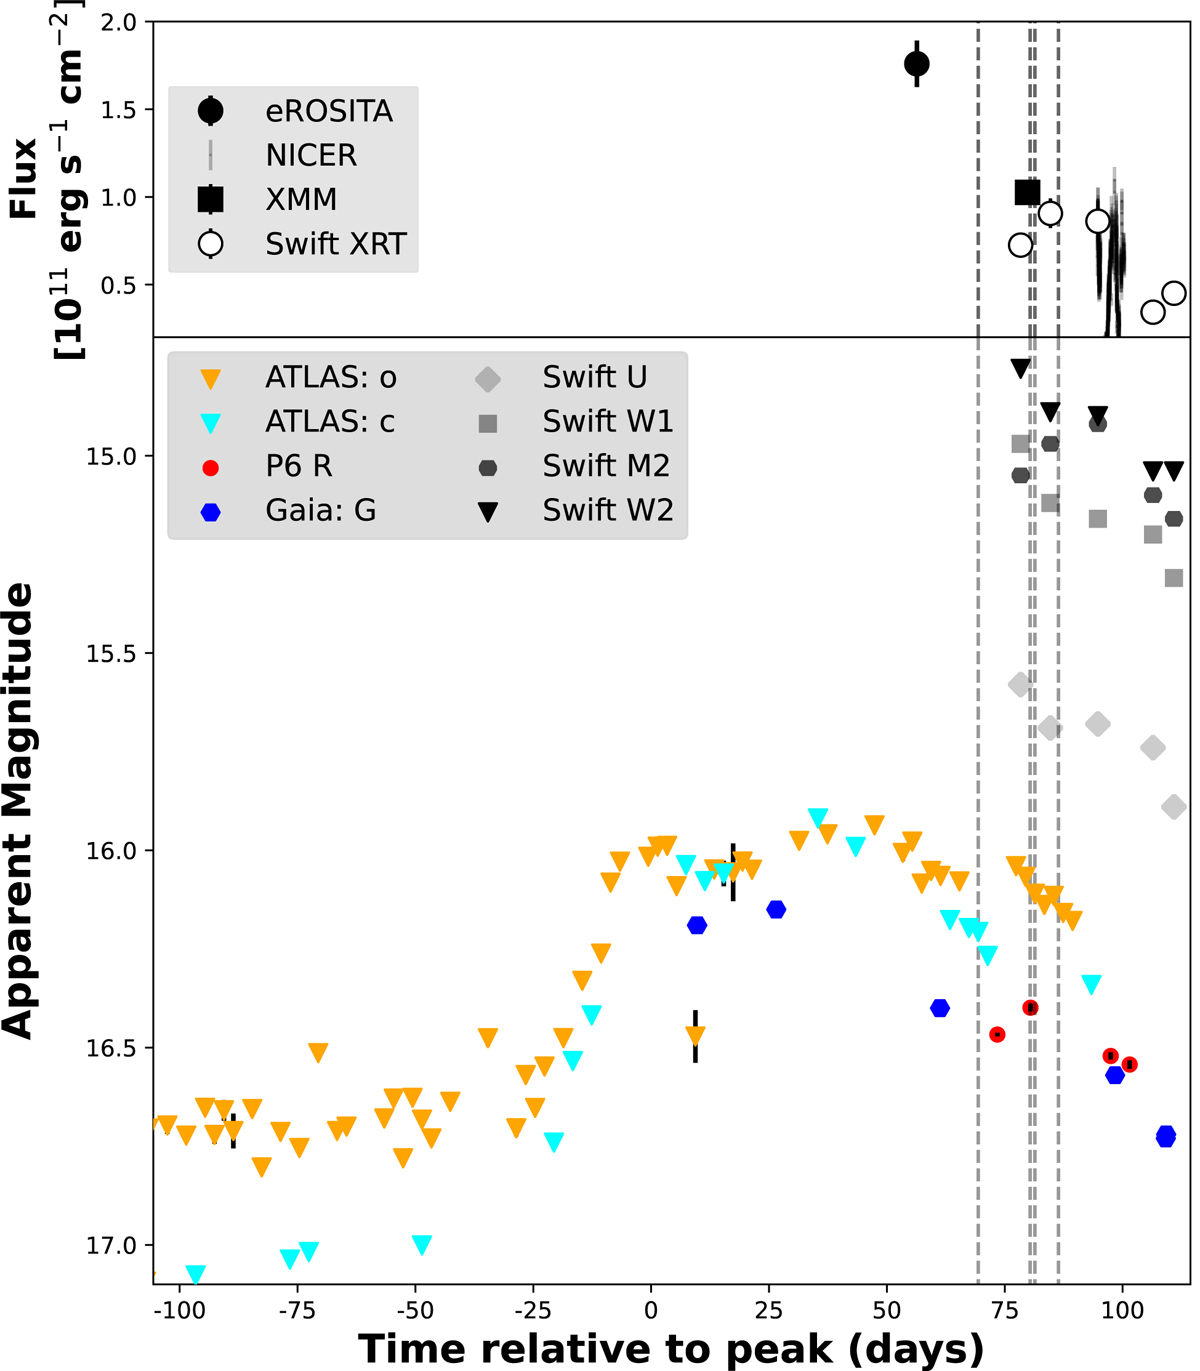
Fig. B.1.
Download original image
The optical, UV, and X-ray light curves around the time of ignition. Fluxes and magnitudes are corrected for Galactic absorption. Top: The X-ray light curve, consisting of the eROSITA, XMM-Newton, Swift-XRT, and NICER data. Bottom: Light curves for ATLAS c and o, Gaia g, Swift-UVOT, and PROMPT6 R data. These data are not host subtracted. The data are plotted in time relative to the point of the first peak in the o-band light curve (see Section 3.1.6). The dashed vertical lines represent the epochs for our optical spectroscopy. The optical data show a sharp increase over approximately 3 weeks, followed by a sharp turnover, a further bump visible in the o and c bands, and subsequent decline. The decline in optical brightness is matched in the UV and X-ray data.
Current usage metrics show cumulative count of Article Views (full-text article views including HTML views, PDF and ePub downloads, according to the available data) and Abstracts Views on Vision4Press platform.
Data correspond to usage on the plateform after 2015. The current usage metrics is available 48-96 hours after online publication and is updated daily on week days.
Initial download of the metrics may take a while.