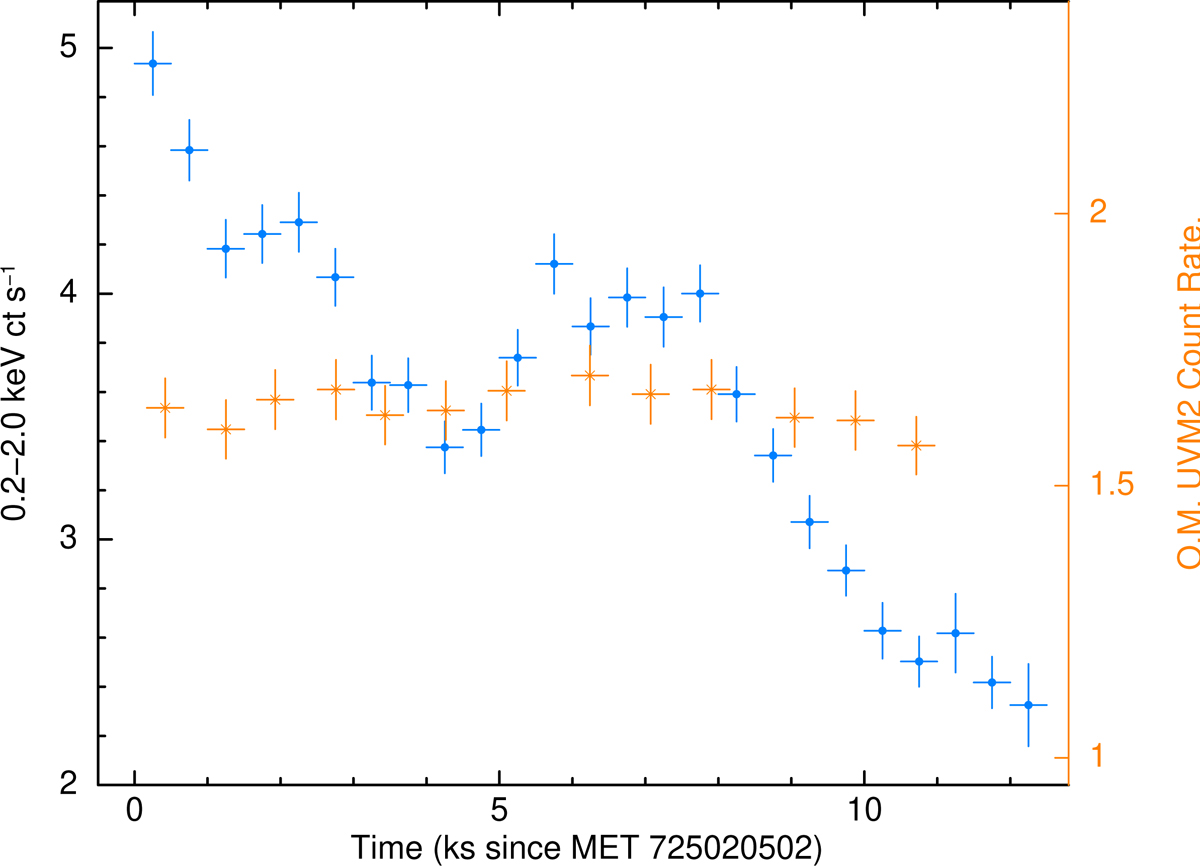
Fig. A.1.
Download original image
XMM-Newton count rate light curves for EPIC pn 0.2–2.0 keV (500 s bins; blue) and for Optical Monitor UVM2 fast mode (800 s bins; orange). MET refers to Mission Elapsed Time, and the MET zeropoint used for the x-axis corresponds to 10:33:53 on 23 December 2020. Both datasets are plotted in counts per second. Whereas the X-ray emission is clearly strongly variable over the duration of the observation, the optical light curve shows no significant variability on this timescale.
Current usage metrics show cumulative count of Article Views (full-text article views including HTML views, PDF and ePub downloads, according to the available data) and Abstracts Views on Vision4Press platform.
Data correspond to usage on the plateform after 2015. The current usage metrics is available 48-96 hours after online publication and is updated daily on week days.
Initial download of the metrics may take a while.