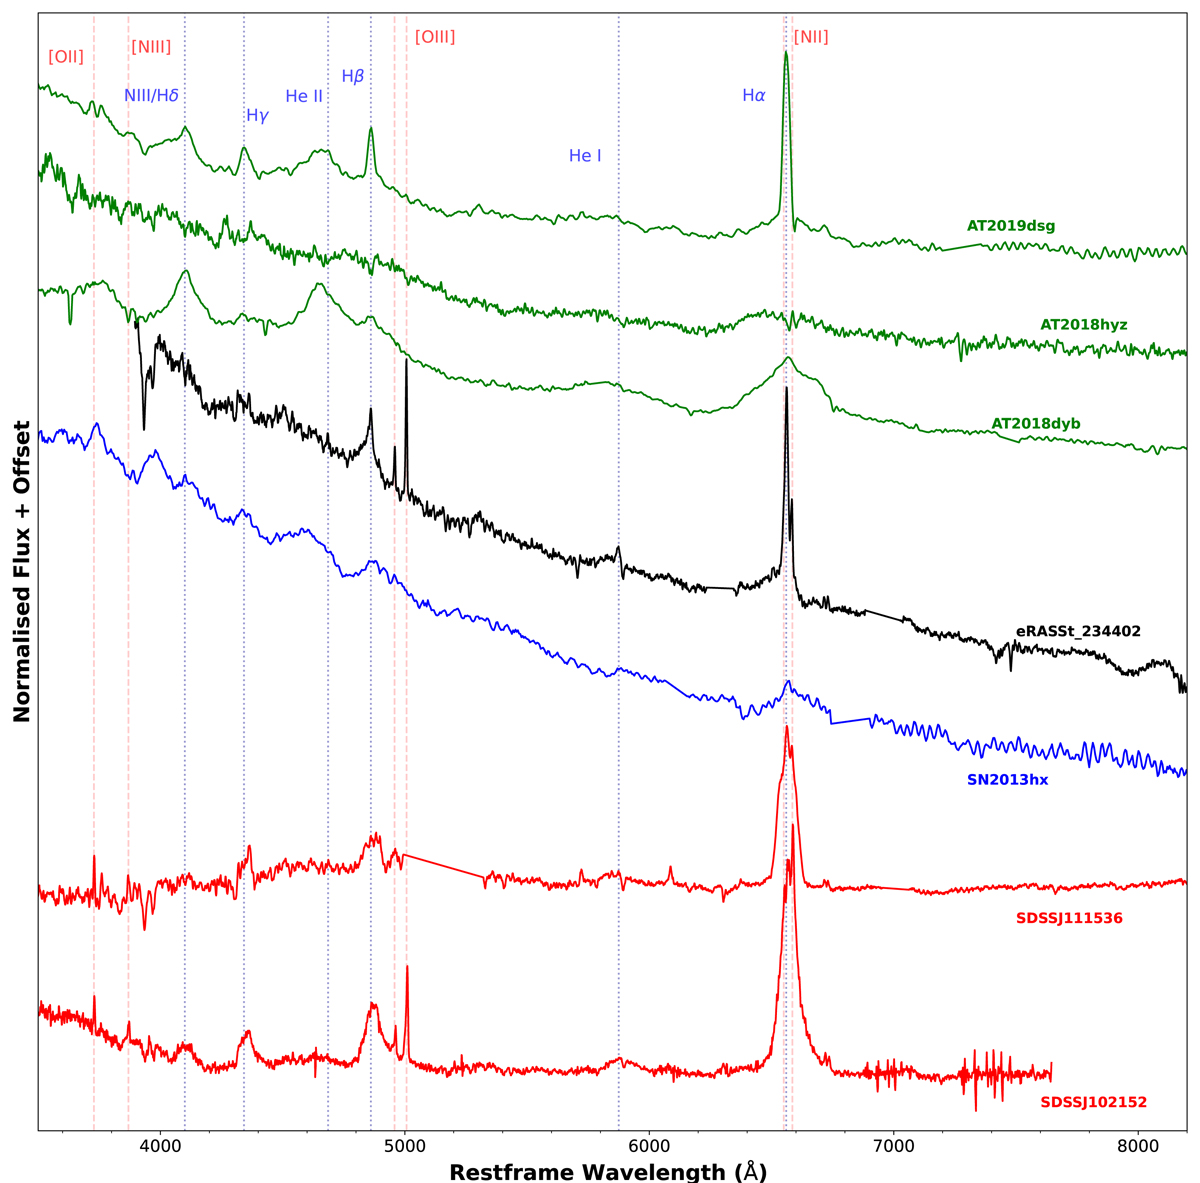
Fig. 11.
Download original image
Spectrum of J234402 compared with spectra of several classes of objects. The optical spectrum of J234402 (black) is shown together with spectra from several other classes of objects that show extreme outbursts: TDEs (green), supernovae (blue), and changing-look AGN (red). The emission lines marked in red (dashed) are those more typically associated with AGN and the emission lines marked in blue (dotted), are those that are prominent in both AGN and TDEs. The narrow-line features of J234402 are more typical of an AGN; however, the broad-line features agree with both a TDE and an AGN interpretation. The included TDE spectra belong to the TDE–H+He AT2019dsg (z = 0.051, spectrum 34 days after discovery, Nicholl et al. 2019), the TDE–H AT2018hyz (z = 0.046, spectrum 6 days after discovery, Dong et al. 2018), and the TDE–H+He AT2018dyb (z = 0.018, spectrum 34 days after peak emission, Leloudas et al. 2019). The SN spectrum belongs to the H-rich SLSN II SN2013hx (z = 0.125, spectrum 55 days after detection, Inserra et al. 2018). The two changing-look AGN spectra both represent the relative high state of the objects: SDSSJ111536.57+054449.7 (z = 0.090, first reported by Yan et al. 2019) and SDSSJ102152.34+464515.6 (z = 0.204, first reported by MacLeod et al. 2016). All spectra have been corrected for redshift, the flux densities have been normalised for the purpose of comparison, and we have removed features that were obviously associated with atmospheric absorption. No correction was made for the host galaxy contribution.
Current usage metrics show cumulative count of Article Views (full-text article views including HTML views, PDF and ePub downloads, according to the available data) and Abstracts Views on Vision4Press platform.
Data correspond to usage on the plateform after 2015. The current usage metrics is available 48-96 hours after online publication and is updated daily on week days.
Initial download of the metrics may take a while.