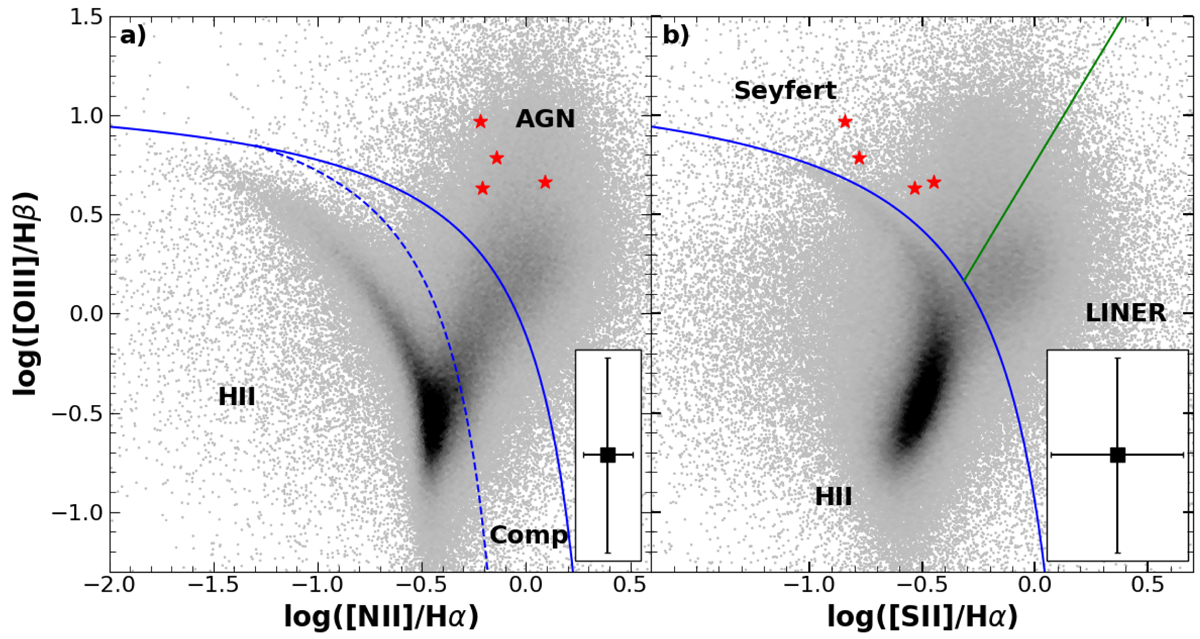
Fig. 10.
Download original image
Line flux diagnostic diagrams (Baldwin et al. 1981) for J234402. The classification curves are from Kewley et al. (2006). The location of each of the J234402 spectra is indicated with a red star. The two subplots show the ratio [OIII]λ5007/Hβ (a) plotted against [NII]λ6584/Hα and (b) plotted against [SII]λ6717/Hα. The shaded regions represent the line flux ratios of ∼100 000 SDSS galaxies (restricted to 0.05 < z < 0.15), using the fluxes made available in the MPA-JHU data release (http://wwwmpa.mpa-garching.mpg.de/SDSS/DR7/). Darker shades of grey mean a higher number density of objects. For the Balmer lines of J234402, the fluxes were calculated using only the narrow components of the line decomposition (Fig. 9). The narrow lines are formed at a kpc-scale distance from the central source and therefore represent a past accretion state. The line diagnostics suggest that the nucleus of J234402 was active for an extended period within the last ∼103 yr. The inset in the bottom left of each plot shows the mean of the formal uncertainties associated with the J234402 spectral fits.
Current usage metrics show cumulative count of Article Views (full-text article views including HTML views, PDF and ePub downloads, according to the available data) and Abstracts Views on Vision4Press platform.
Data correspond to usage on the plateform after 2015. The current usage metrics is available 48-96 hours after online publication and is updated daily on week days.
Initial download of the metrics may take a while.