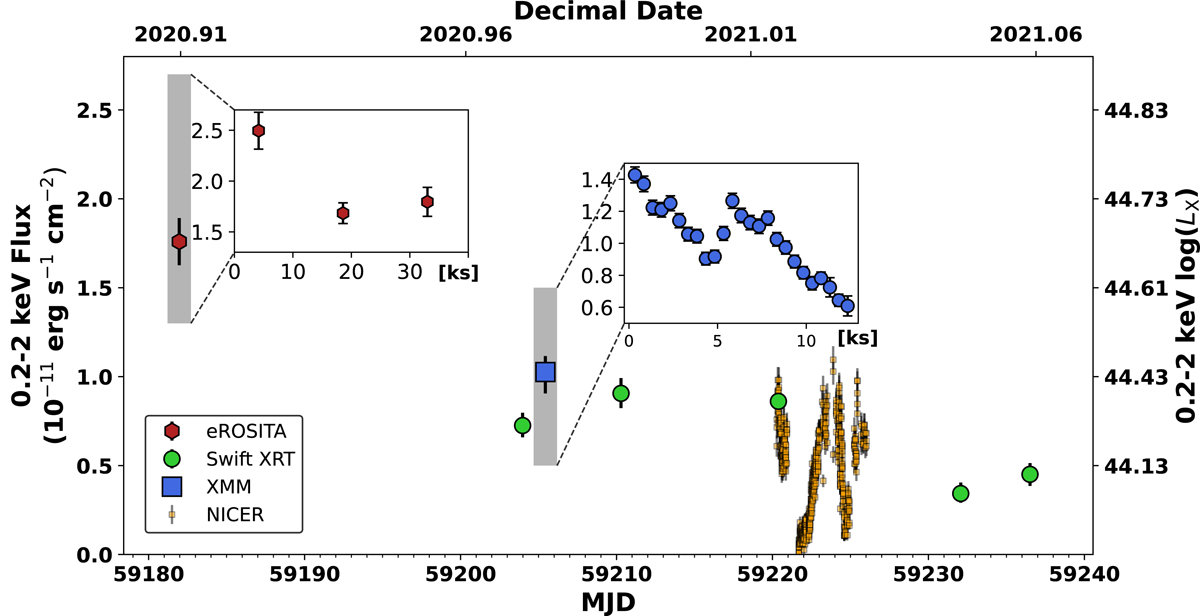
Fig. 1.
Download original image
Overview of X-ray data collected on J234402. The light curve starts from the detection of the ignition event with eROSITA in November 2020. The 3σ upper limit of the eRASS1 scan in May 2020 was 1.1 × 10⁻¹³ erg cm−2 s−1 (log10(LX/[erg s−1]) = 41.8). The flux evolution over time is significant, showing both an overall decrease and large fluctuations on shorter timescales. To illustrate the magnitude of the variability on the shortest timescales, the light curves of individual eRASS2 scans and for the XMM-Newton EPIC-pn data, binned to 500s, are included in insets. The vertical extent of the grey boxes around the eROSITA and XMM-Newton markers shows the size of the y-axes of the insets within the larger plot. In the inset of the eROSITA light curve the horizontal axis marks the time in ks since MJD 59181.75, and in the inset of the XMM-Newton light curve it marks the time in ks since MJD 59205.44. On the right vertical axis we show the log10(LX/[erg s−1]) values associated with the observed flux. To calculate these values, we made use of the best-fit model (2BB, Sect. 2.2).
Current usage metrics show cumulative count of Article Views (full-text article views including HTML views, PDF and ePub downloads, according to the available data) and Abstracts Views on Vision4Press platform.
Data correspond to usage on the plateform after 2015. The current usage metrics is available 48-96 hours after online publication and is updated daily on week days.
Initial download of the metrics may take a while.