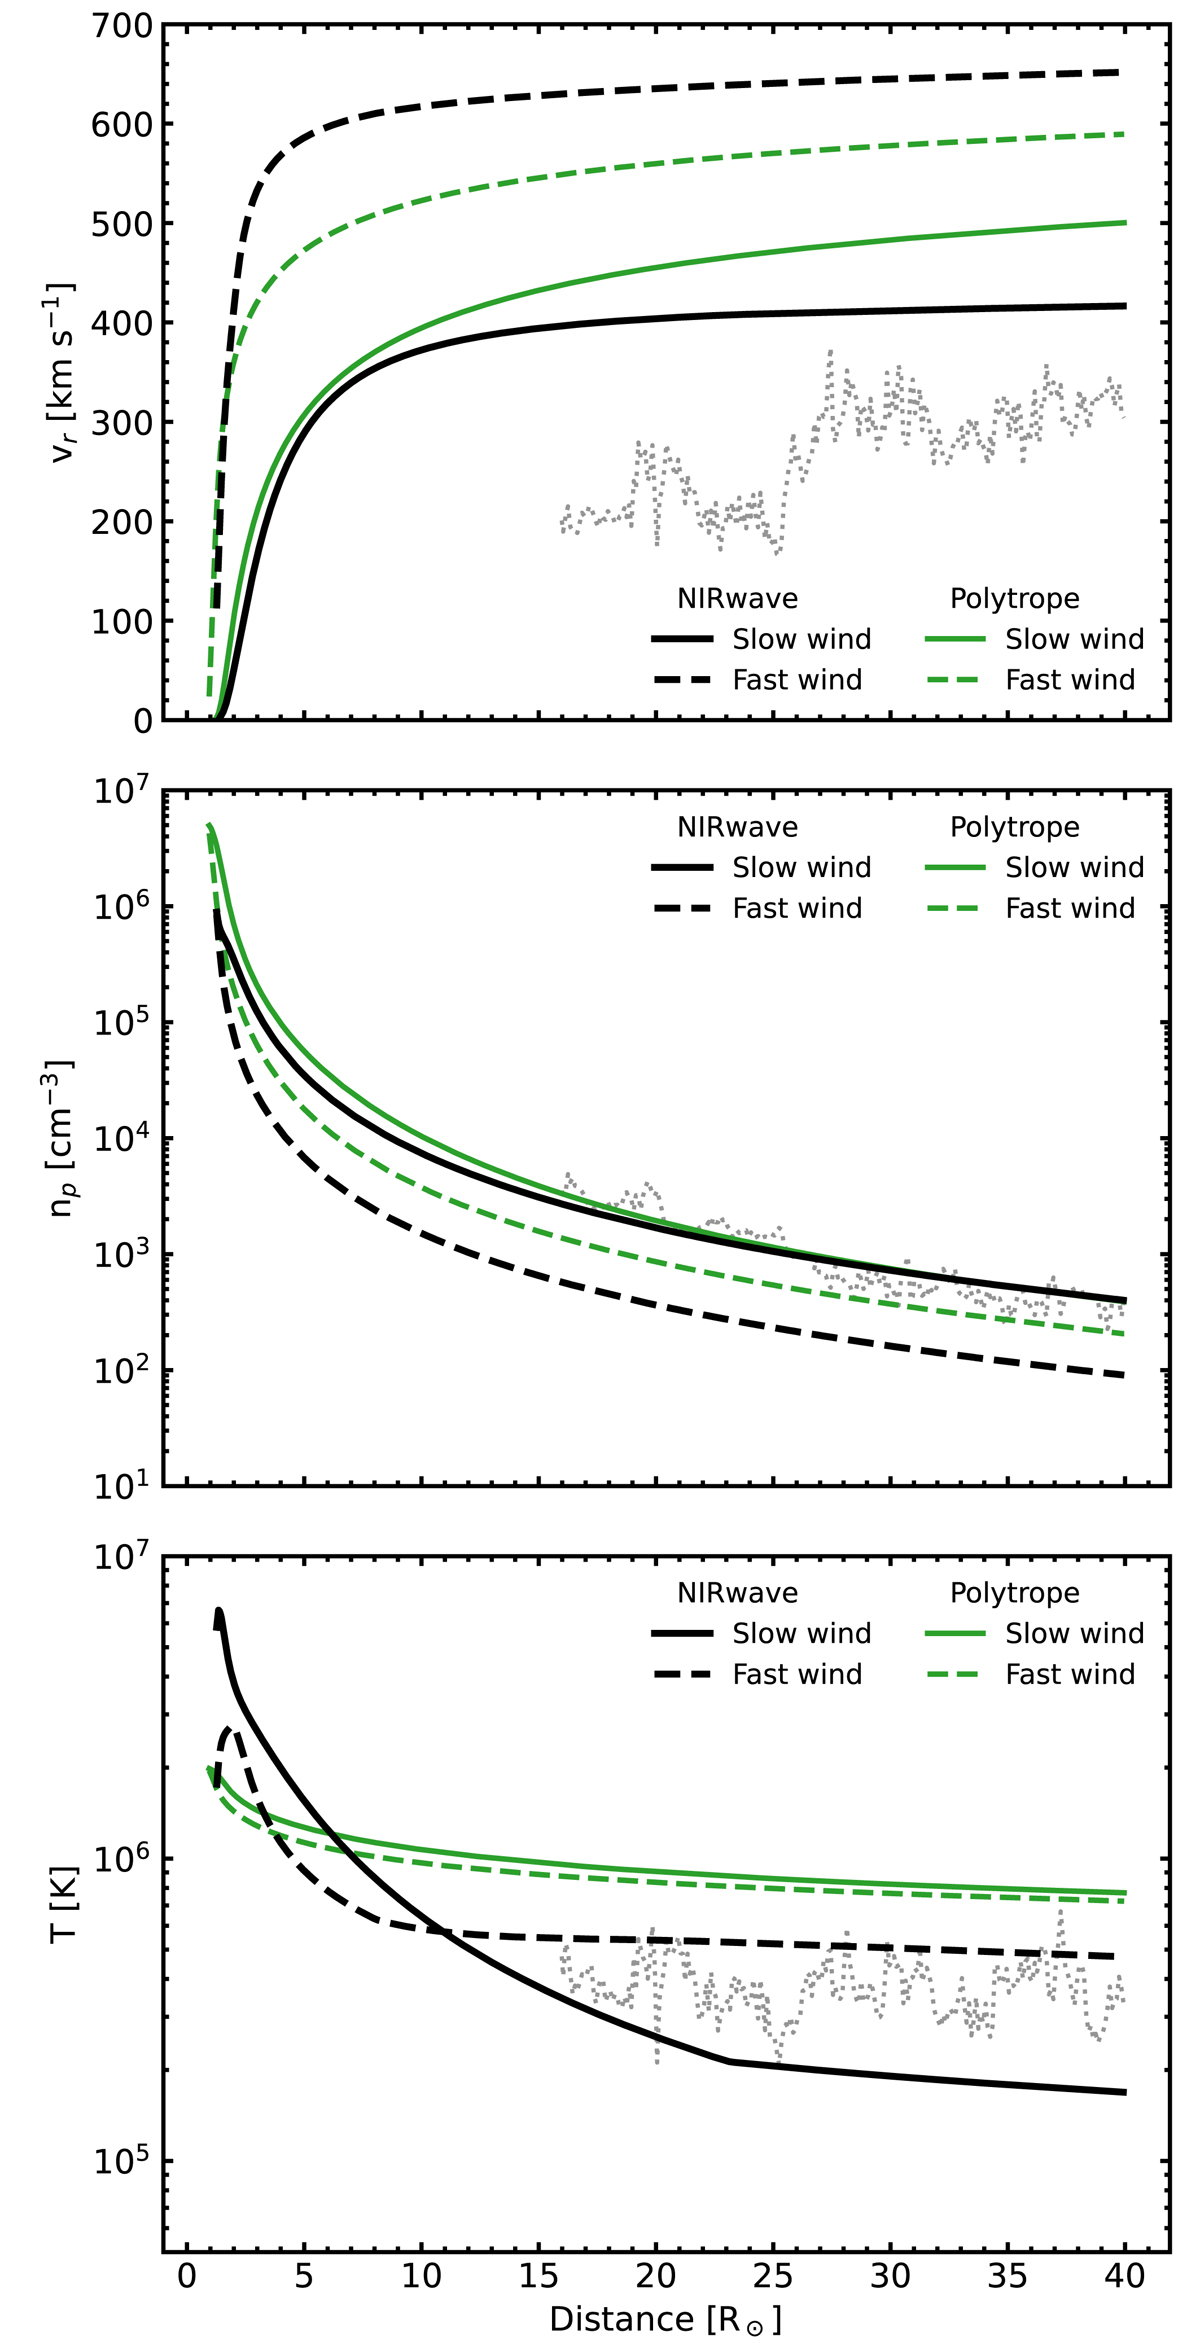
Fig. 7.
Download original image
Comparison between the solar wind model generated with NIRwave (black lines) and a polytropic model using NIRVANA (green lines). The panels show the radial wind velocity (vr, top panel), number density (np, middle panel), and temperature (T, bottom panel), each with respect to radial distance in R⊙ from the domain centre. The solid lines represent equatorial radial parameter profiles associated with the slow wind regime, and dashed lines represent polar radial parameter profiles associated with the fast wind. The grey dotted lines in each panel represent the observational data from PSP described in Sect. 3.
Current usage metrics show cumulative count of Article Views (full-text article views including HTML views, PDF and ePub downloads, according to the available data) and Abstracts Views on Vision4Press platform.
Data correspond to usage on the plateform after 2015. The current usage metrics is available 48-96 hours after online publication and is updated daily on week days.
Initial download of the metrics may take a while.