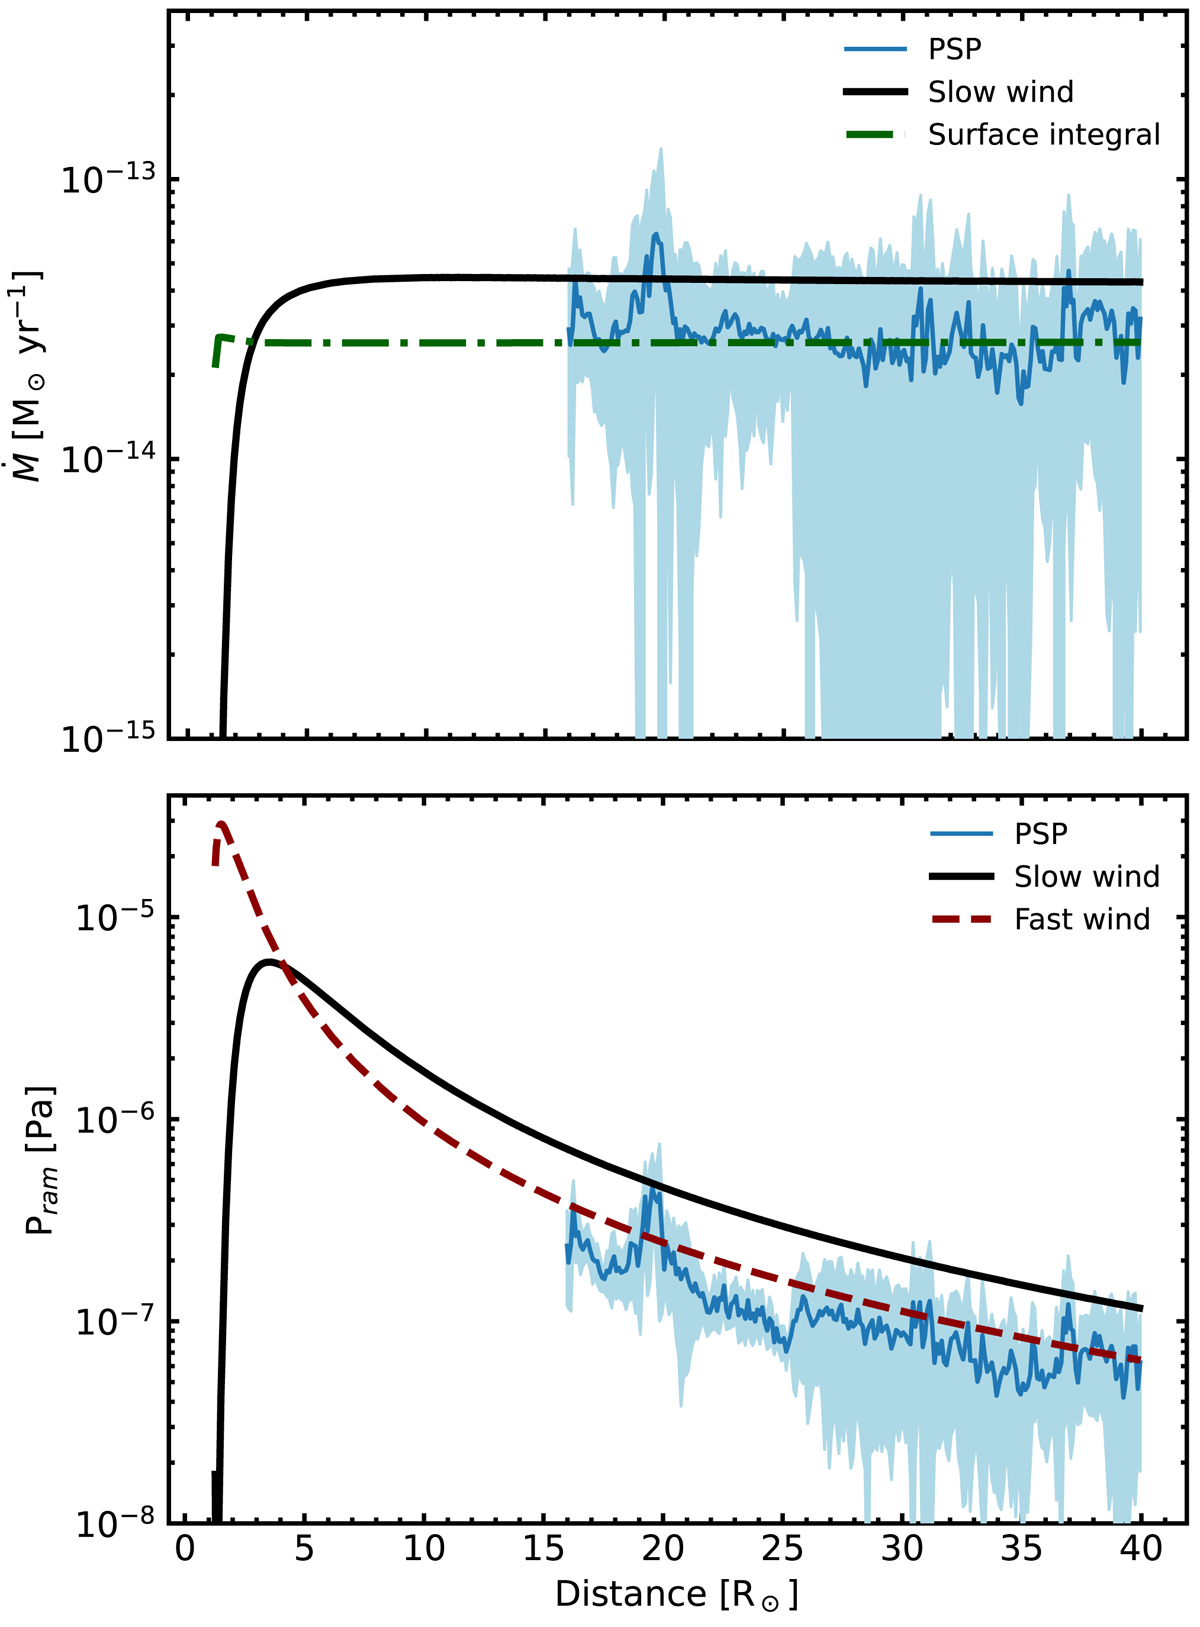
Fig. 6.
Download original image
Mass-loss rate Ṁ and ram pressure Pram as radial profiles compared to the empirical constraints derived from observations taken by PSP. In both panels, the black solid line represents an equatorial radial profile taken from the simulation and the blue line and filled-in area represent the mean observational values from PSP and a deviation of 1σ, respectively. Upper panel: mass-loss rate Ṁ. The green dashed-dotted line represents the mass-loss rate derived from surface integrals following Eq. (16) for radial shells distributed throughout the simulation domain. Lower panel: ram pressure Pram. The red solid line represent the radial polar profile from our simulation results.
Current usage metrics show cumulative count of Article Views (full-text article views including HTML views, PDF and ePub downloads, according to the available data) and Abstracts Views on Vision4Press platform.
Data correspond to usage on the plateform after 2015. The current usage metrics is available 48-96 hours after online publication and is updated daily on week days.
Initial download of the metrics may take a while.