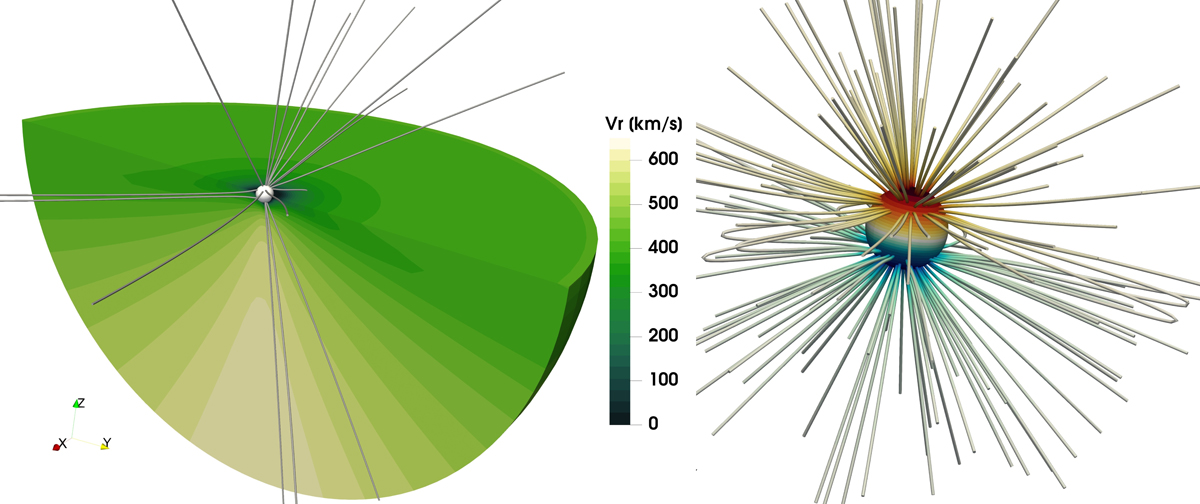
Fig. 2.
Download original image
Three-dimensional structure of our steady-state solar wind simulation. Left: radial-velocity structure (colour map) and magnetic field lines (grey lines). Right: Close-in structure of the magnetic field within 10 R⊙. The spherical surface denotes the inner boundary of our domain and shows the surface field strength of the radial magnetic field component Br as a colour gradient between the north and south pole of the domain. The grey lines represent the connected field lines.
Current usage metrics show cumulative count of Article Views (full-text article views including HTML views, PDF and ePub downloads, according to the available data) and Abstracts Views on Vision4Press platform.
Data correspond to usage on the plateform after 2015. The current usage metrics is available 48-96 hours after online publication and is updated daily on week days.
Initial download of the metrics may take a while.