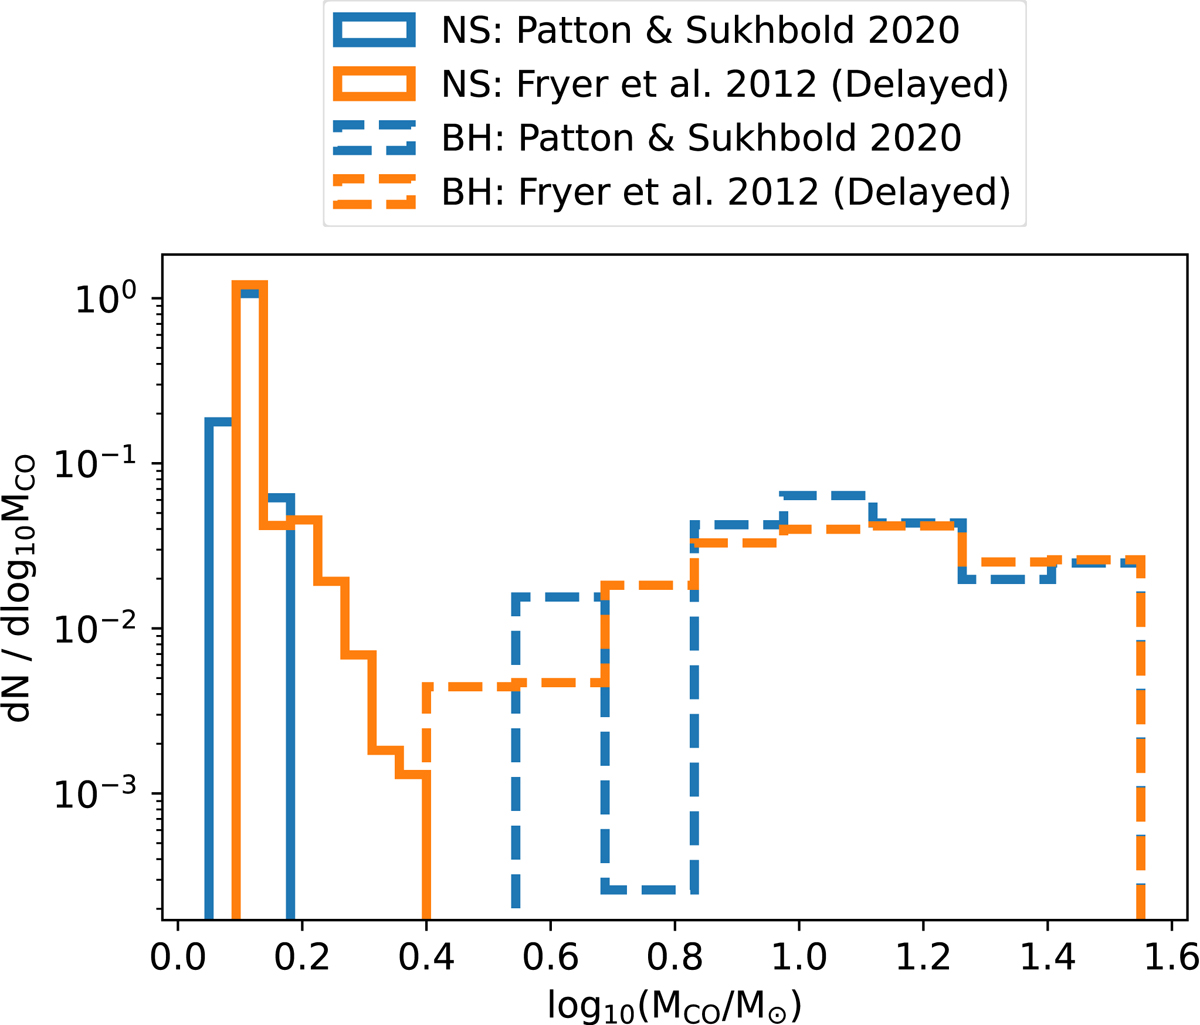
Fig. 5.
Download original image
Distribution of newly formed CO masses (MCO) for binaries that remain bound post-SN, for the default population with the parameters in Table 2, including the Patton & Sukhbold (2020) SN mechanism (blue line) and the population with the Fryer et al. (2012, delayed) SN mechanism (orange line). The populations are further split by the type of CO, NS (solid line), and BH (dashed line). The distributions have been weighted with the same factor that normalizes the maximum counts per bin for the default population for NS formation (NS: Patton & Sukhbold 2020, solid blue line) to 1.
Current usage metrics show cumulative count of Article Views (full-text article views including HTML views, PDF and ePub downloads, according to the available data) and Abstracts Views on Vision4Press platform.
Data correspond to usage on the plateform after 2015. The current usage metrics is available 48-96 hours after online publication and is updated daily on week days.
Initial download of the metrics may take a while.