Open Access
Fig. A.1
Download original image
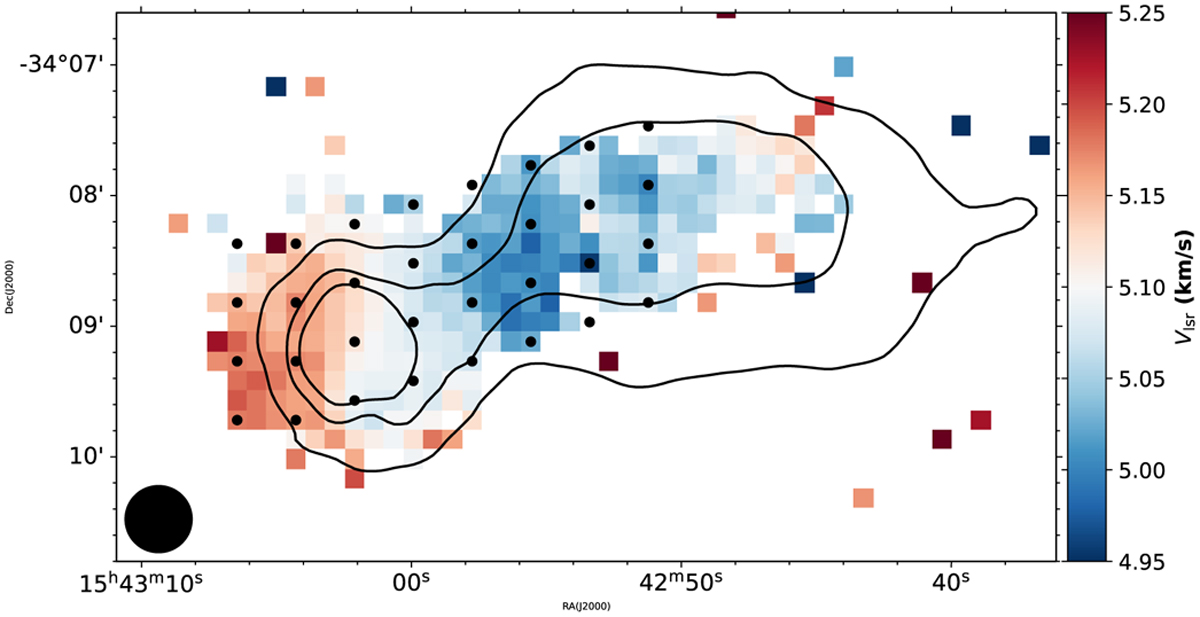
Map of centroid velocity od DCO+ (3–2). The black dots showing the position of each spectrum. Overlaid in black contours is the H2 column density (levels:[1.0, 1.5, 2.0] 1022 cm−2).
Current usage metrics show cumulative count of Article Views (full-text article views including HTML views, PDF and ePub downloads, according to the available data) and Abstracts Views on Vision4Press platform.
Data correspond to usage on the plateform after 2015. The current usage metrics is available 48-96 hours after online publication and is updated daily on week days.
Initial download of the metrics may take a while.