Open Access
Fig. 8
Download original image
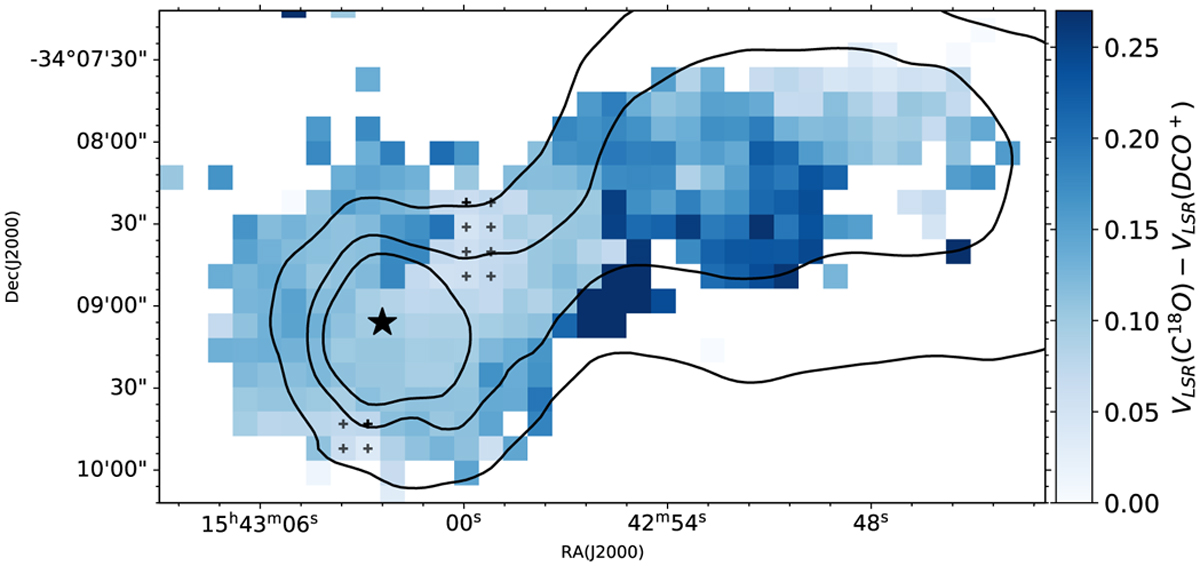
Map of velocity shift between C180 (2–1) and DCO+ (3–2). Overlaid in black contours is the H2 column density (levels: [1.0,1.5,2.0] × l022 cm−2). The black star represents the position of the protostar and the black plus signs are positions of the lowest velocity shifts, which are used for the mean value.
Current usage metrics show cumulative count of Article Views (full-text article views including HTML views, PDF and ePub downloads, according to the available data) and Abstracts Views on Vision4Press platform.
Data correspond to usage on the plateform after 2015. The current usage metrics is available 48-96 hours after online publication and is updated daily on week days.
Initial download of the metrics may take a while.