Fig. 7
Download original image
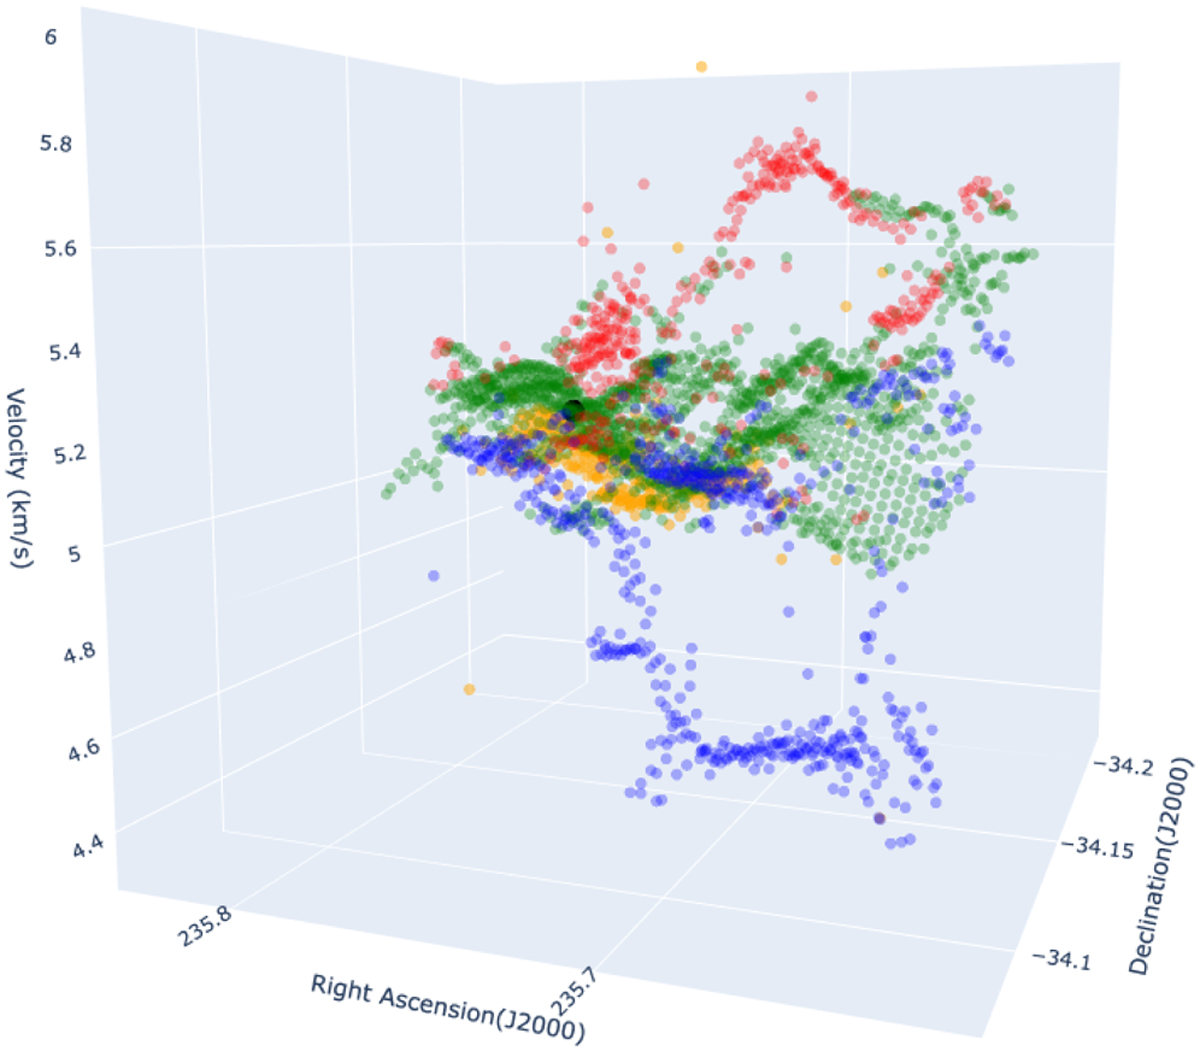
PPV image of C180 (2–1) and DCO+ (3–2) gas. Each data point denotes the location and centroid velocity of a Gaussian component and each color refers to a different Gaussian fit. The centroid velocity is shown for the DCO+ (3–2) line (in orange), and the green data points represent the brightest component of the C180 (2–1) line. The red and blue data points indicate the two lower intensity velocity components. The black circle represents the position of the protostar.
Current usage metrics show cumulative count of Article Views (full-text article views including HTML views, PDF and ePub downloads, according to the available data) and Abstracts Views on Vision4Press platform.
Data correspond to usage on the plateform after 2015. The current usage metrics is available 48-96 hours after online publication and is updated daily on week days.
Initial download of the metrics may take a while.