Fig. 6
Download original image
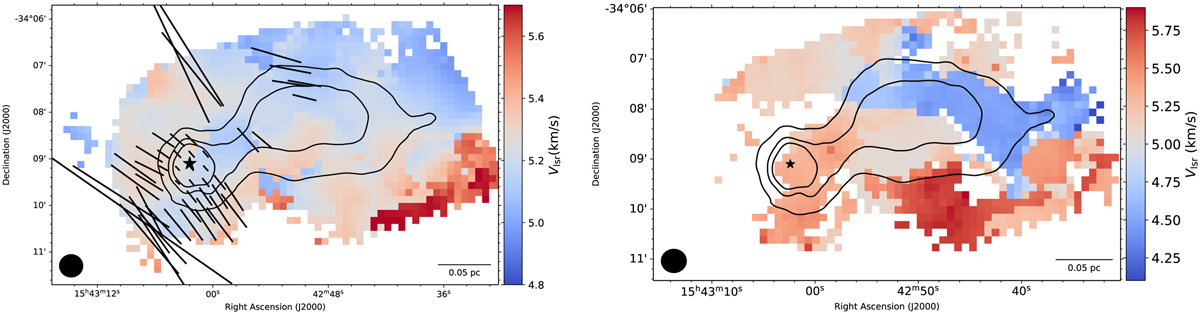
Maps of kinematic parameters. Left panel: bright component of centroid velocity map of C18O (2–1). Right panel: centroid velocity map only showing the weak component of the Gaussian fitting. The black vectors represent the polarization angles, tilted by 90 degrees. The star shows the position of the protostar. The contours represent N(H2) column density levels, as derived from Herschel data: [1.0,1.5,2.0] × 1022 cm−2.
Current usage metrics show cumulative count of Article Views (full-text article views including HTML views, PDF and ePub downloads, according to the available data) and Abstracts Views on Vision4Press platform.
Data correspond to usage on the plateform after 2015. The current usage metrics is available 48-96 hours after online publication and is updated daily on week days.
Initial download of the metrics may take a while.