Open Access
Fig. 5
Download original image
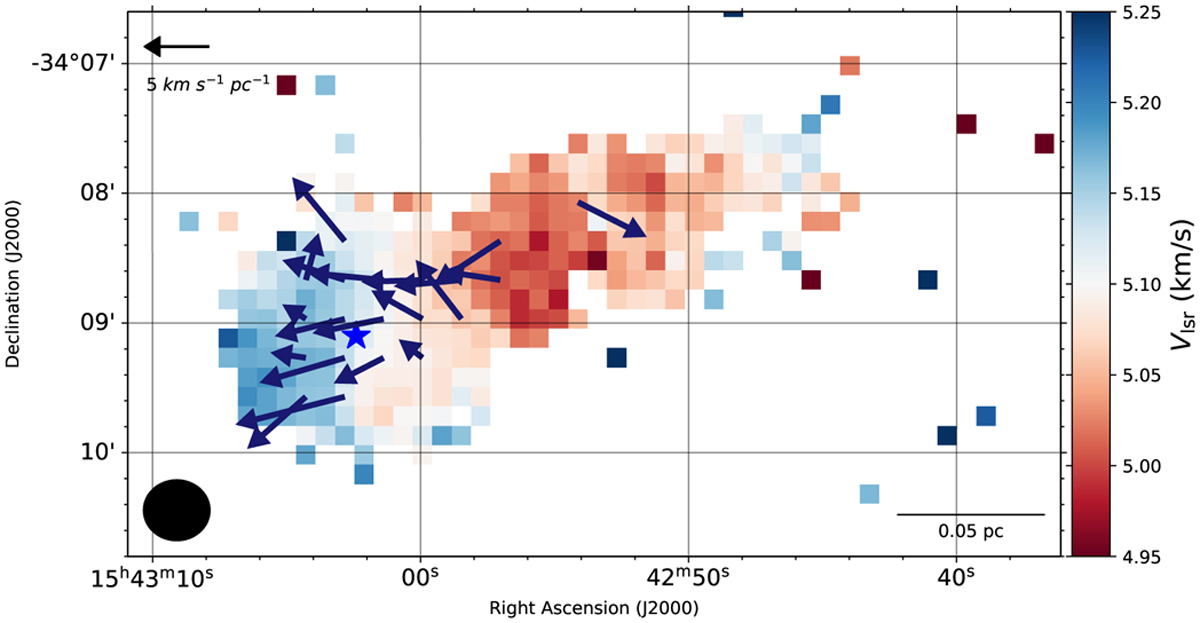
Centroid velocity map of the DCO+ (3–2) line overlaid with the gradient arrows (only vectors with S/N > 3 are shown). The arrow length represents the relative vector magnitude of the gradient, according to the scale shown in the top left corner, and the direction of the arrows points to the steepest velocity field change.
Current usage metrics show cumulative count of Article Views (full-text article views including HTML views, PDF and ePub downloads, according to the available data) and Abstracts Views on Vision4Press platform.
Data correspond to usage on the plateform after 2015. The current usage metrics is available 48-96 hours after online publication and is updated daily on week days.
Initial download of the metrics may take a while.