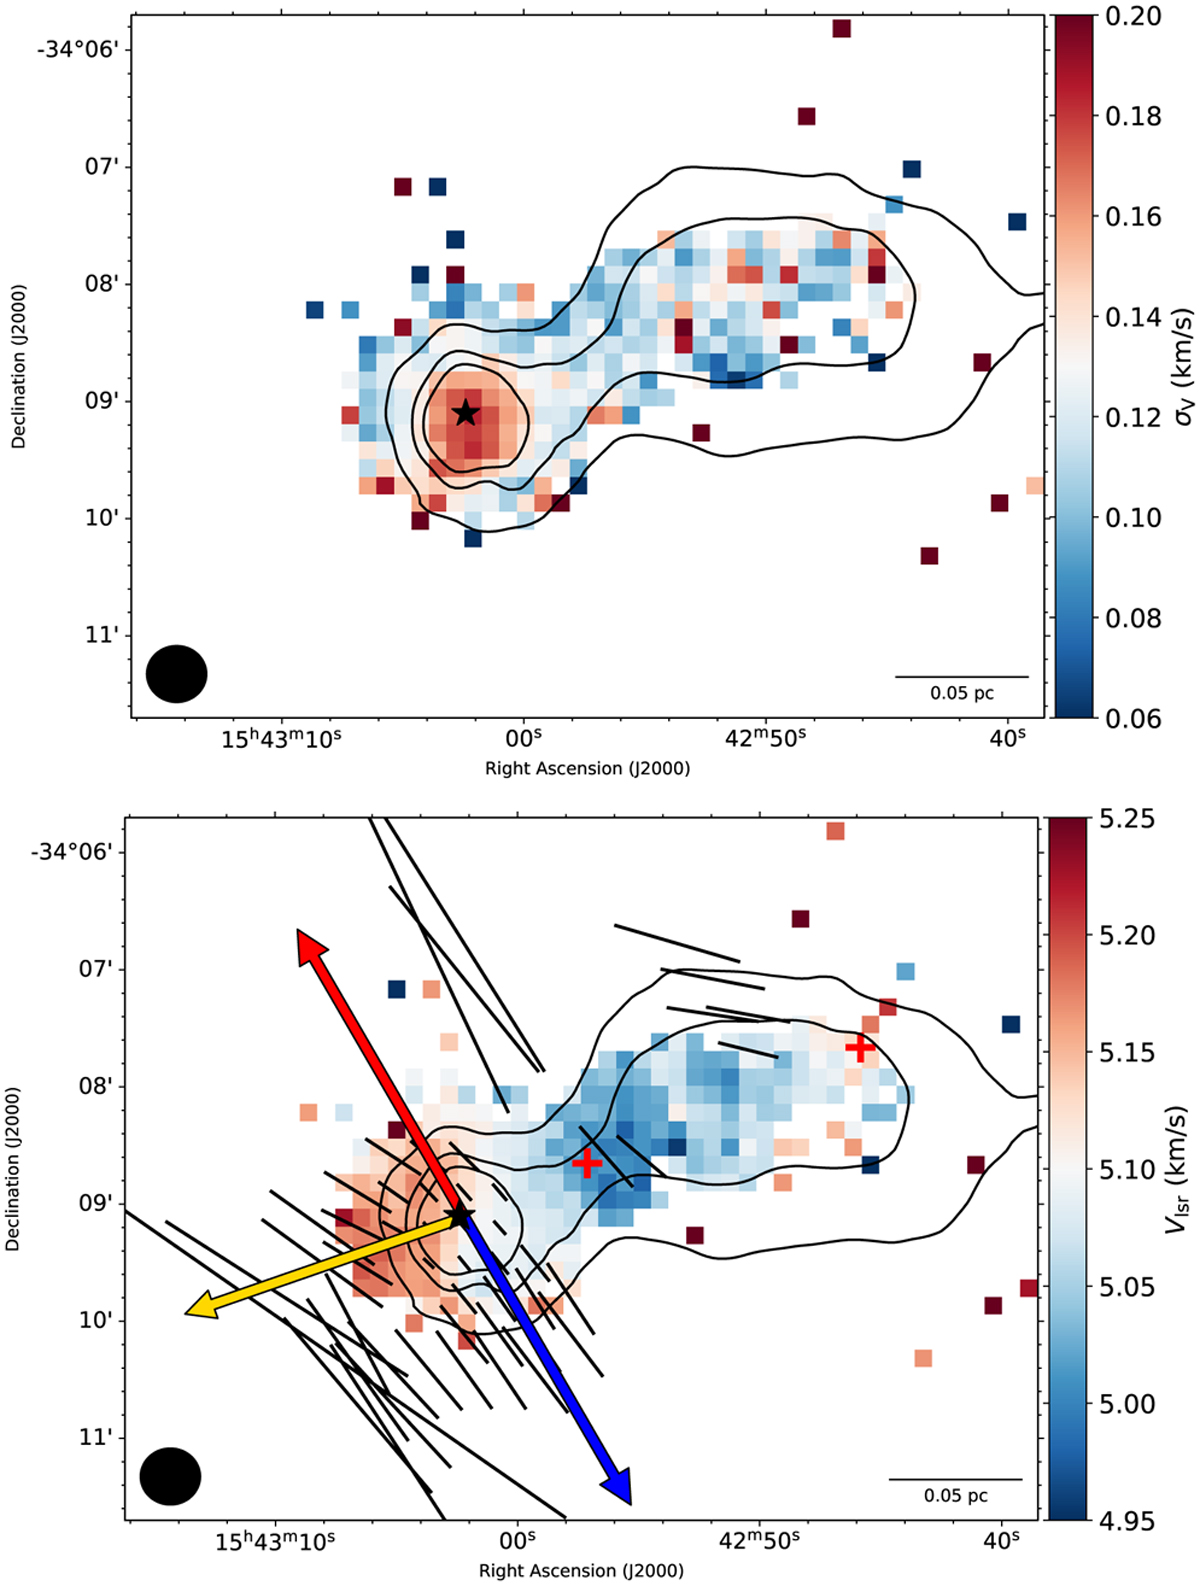
Fig. 4
Download original image
Maps of kinematic parameters. Top: gas velocity dispersion of the cloud traced using the DCO+ (3-2). Bottom: centroid velocity map obtained fitting the observed DCO+ (3-2). The black vectors represent the polarization angles, tilted by 90 degrees to trace the magnetic field direction (Redaelli et al. 2019a). The blue and red arrows show the direction of the outflow (PA = 35°, from Bjerkeli et al. 2016), and the yellow arrow presents the mean velocity gradient direction around the core. The star shows the position of the protostar. The contours represent N(H2) column density levels, as derived from Herschel data: [1.0, 1.5, 2.0] 1022 cm−2.
Current usage metrics show cumulative count of Article Views (full-text article views including HTML views, PDF and ePub downloads, according to the available data) and Abstracts Views on Vision4Press platform.
Data correspond to usage on the plateform after 2015. The current usage metrics is available 48-96 hours after online publication and is updated daily on week days.
Initial download of the metrics may take a while.