Fig. 1
Download original image
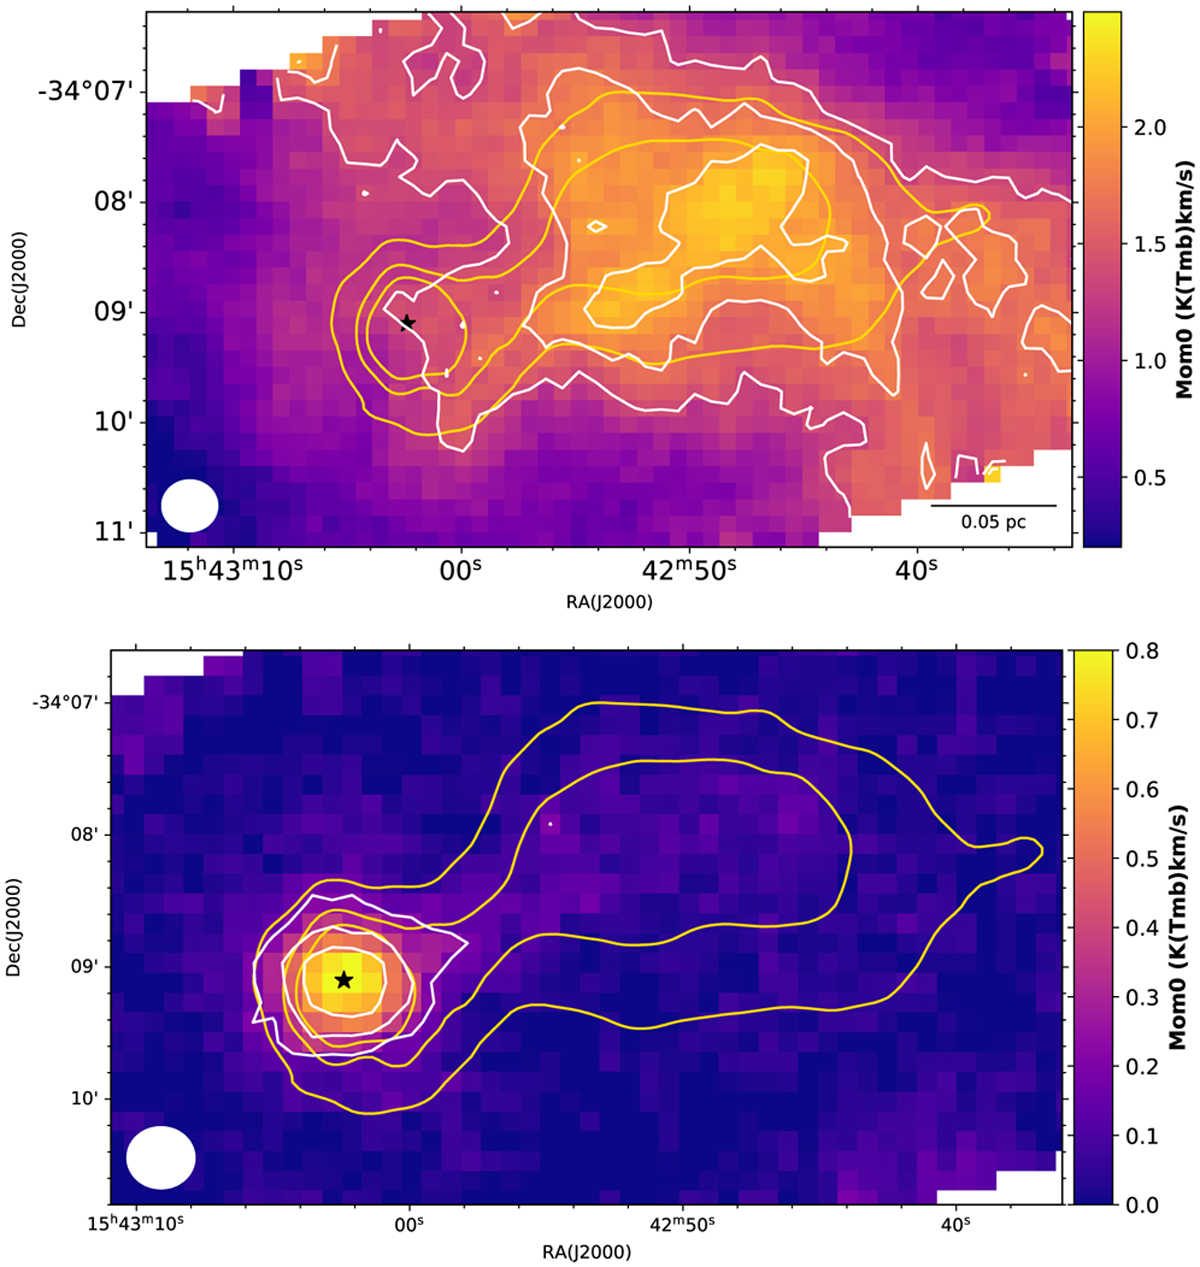
Integrated intensity of C18O (1–2) (top) and DCO+ (3–2) (bottom) toward IRAS 15398. The white contour levels are 10, 20, and 30 times of mean rms value for the DCO+ line and 40, 50, and 60 times of mean rms value for the C18O (2–1) line. The beam size is shown in the bottom left corner. The yellow contours in both images show H2 column density (levels:[1.0, 1.5, 2.0] 1022 cm−2). The black star gives the position of the protostar.
Current usage metrics show cumulative count of Article Views (full-text article views including HTML views, PDF and ePub downloads, according to the available data) and Abstracts Views on Vision4Press platform.
Data correspond to usage on the plateform after 2015. The current usage metrics is available 48-96 hours after online publication and is updated daily on week days.
Initial download of the metrics may take a while.