Fig. 5.
Download original image
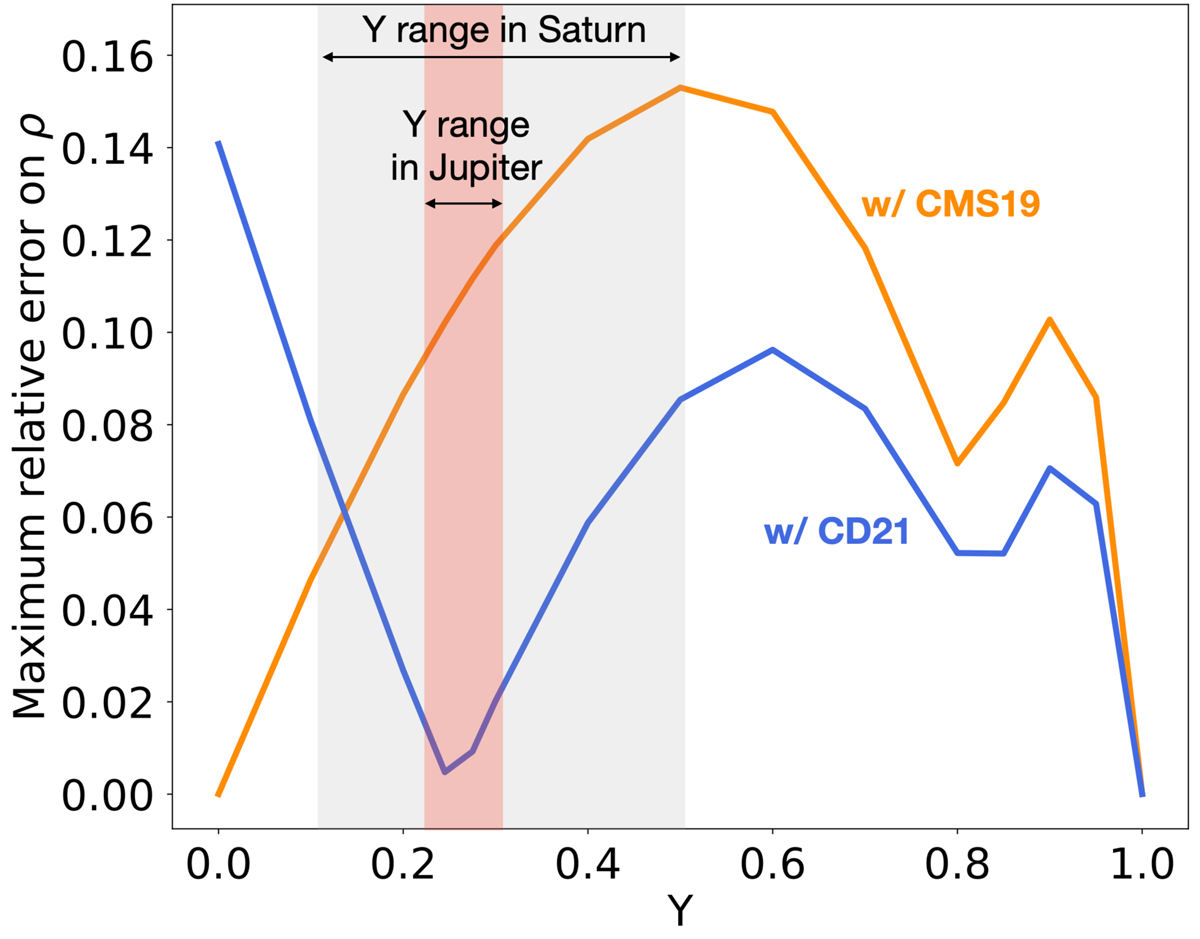
Comparison in density of our new EOS (this work) based on the non-ideal mixing effects derived in Sect. 2 with both CD21 and CMS19, according to the helium mass fraction Y. The shaded red and grey areas correspond to the range of values of Y in Jupiter (taken from models of Miguel et al. 2022) and Saturn (taken from Mankovich & Fuller 2021), respectively.
Current usage metrics show cumulative count of Article Views (full-text article views including HTML views, PDF and ePub downloads, according to the available data) and Abstracts Views on Vision4Press platform.
Data correspond to usage on the plateform after 2015. The current usage metrics is available 48-96 hours after online publication and is updated daily on week days.
Initial download of the metrics may take a while.