Fig. 10
Download original image
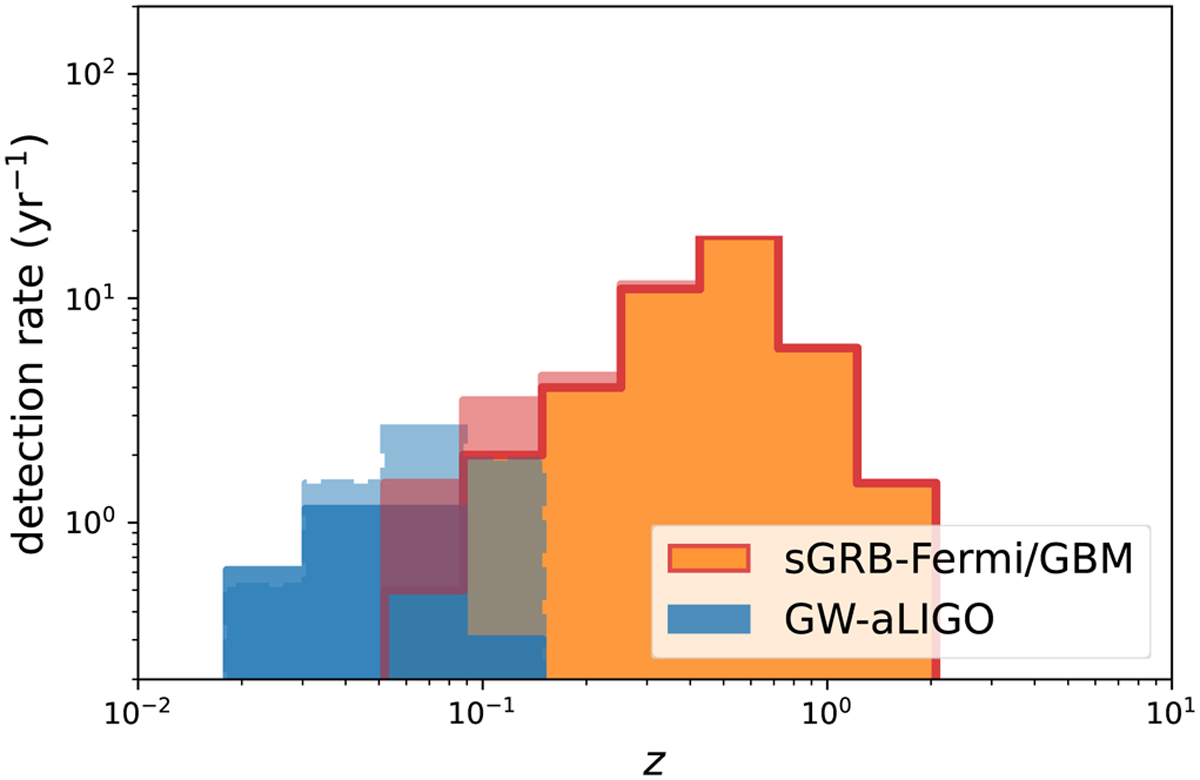
Redshift distribution of BNSs through detection of GWs and sGRBs. In blue, we show the distribution for LIGO (design sensitivity), where the shaded region with the dotted line represents the distribution for those GW sources with S/N between 6 and 8. In orange, we plot the distribution of Fermi/GBM GRBs (the same distribution as in Figs. 11–13), where the red region corresponds to the off-axis GRBs, generated with the addition to our model as described in Sect. 3.4.
Current usage metrics show cumulative count of Article Views (full-text article views including HTML views, PDF and ePub downloads, according to the available data) and Abstracts Views on Vision4Press platform.
Data correspond to usage on the plateform after 2015. The current usage metrics is available 48-96 hours after online publication and is updated daily on week days.
Initial download of the metrics may take a while.