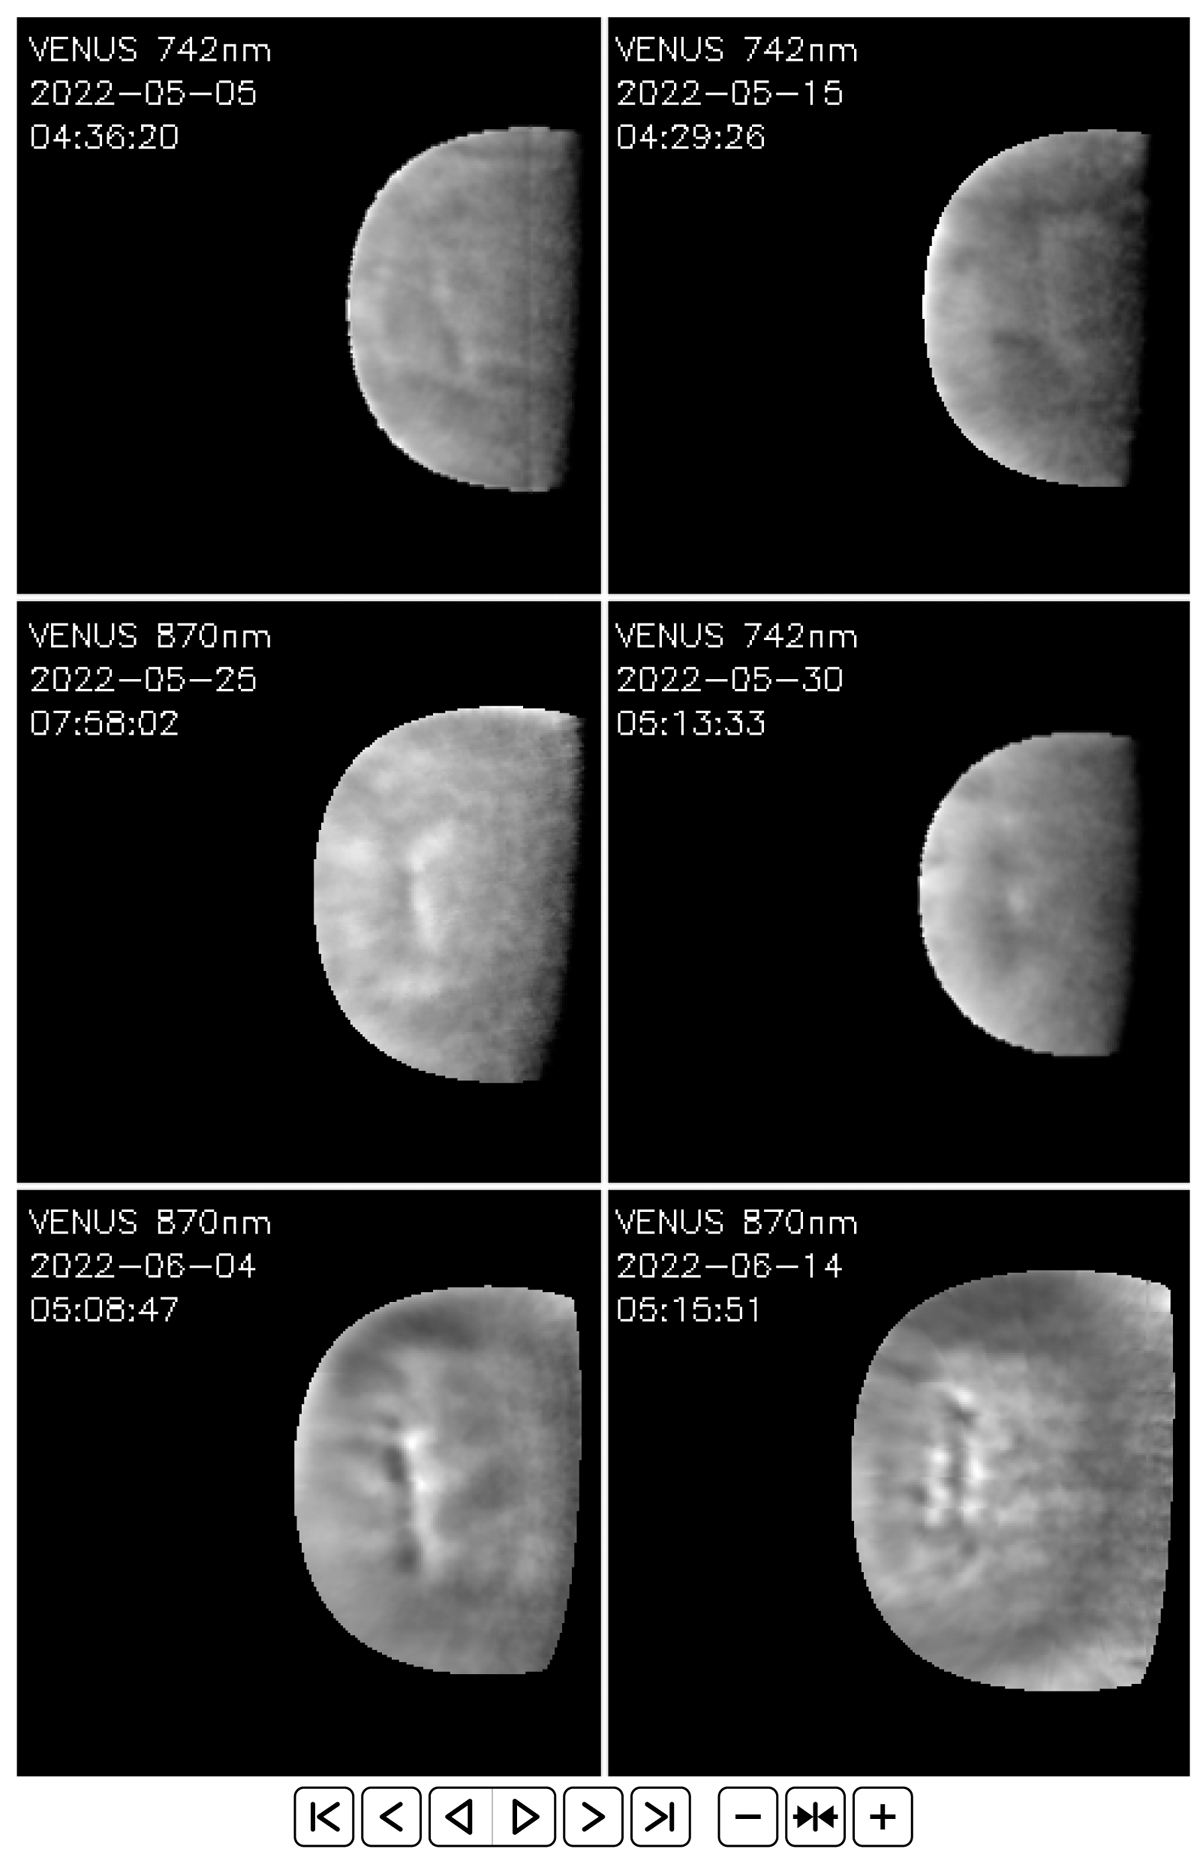
Fig. C.1.
Download original image
Cloud layers during six discontinuity events in 2022. By means of images acquired within less than 1 hour of difference, this interactive animation allows a comparison of the patterns at the top of the clouds (Akatsuki/UVI 365 nm images) when the discontinuity was apparent in the images of the middle clouds. As in Fig. A.1, 90°N–90°S projections in local hour coordinates and resolution of 0.75° per pixel are shown. Coordinate grid suppressed for a better visualisation. This interactive animation is available in PDF file using Acrobat Reader®.
Current usage metrics show cumulative count of Article Views (full-text article views including HTML views, PDF and ePub downloads, according to the available data) and Abstracts Views on Vision4Press platform.
Data correspond to usage on the plateform after 2015. The current usage metrics is available 48-96 hours after online publication and is updated daily on week days.
Initial download of the metrics may take a while.