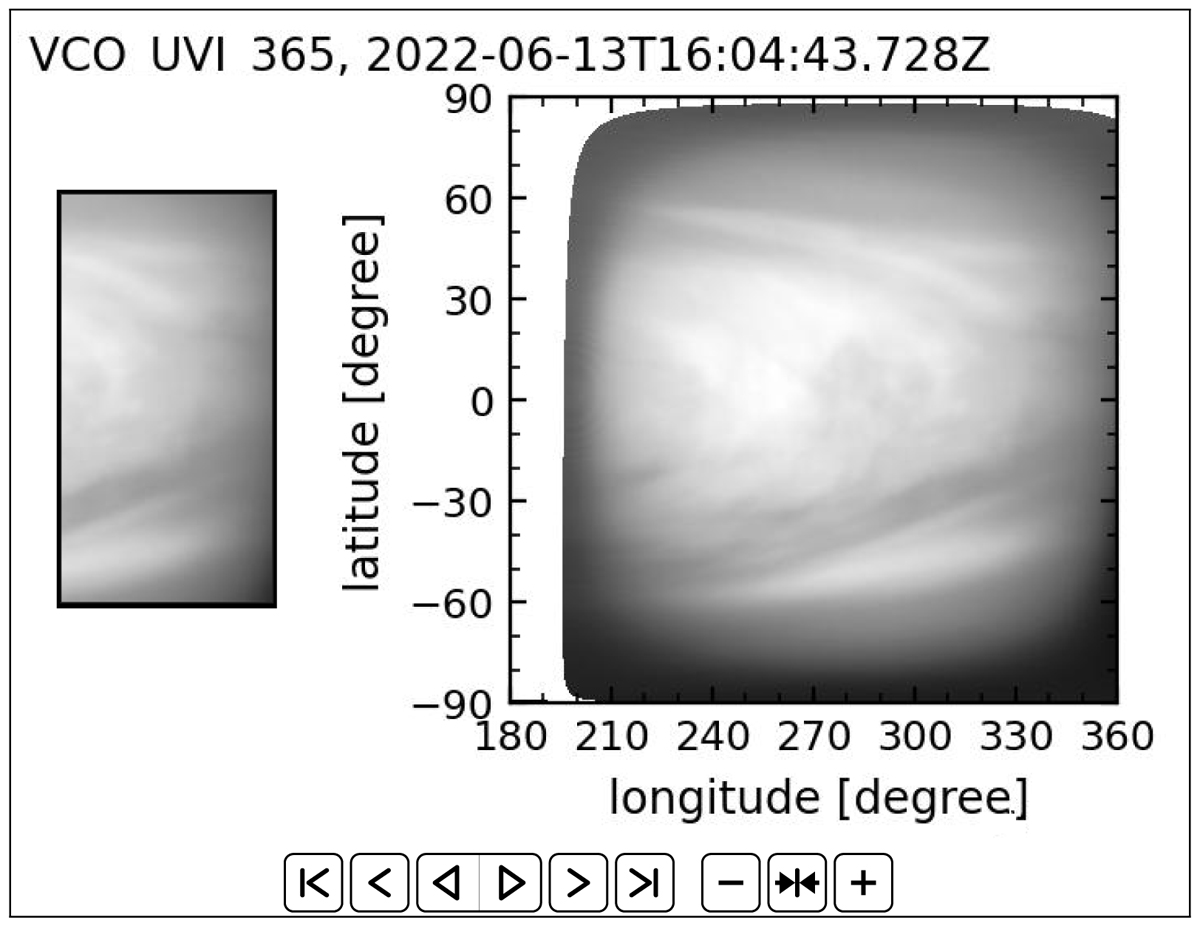
Fig. 3.
Download original image
Evolution of the discontinuity-like pattern observed at the top of the clouds with Akatsuki/UVI images. This interactive animation exhibits the morphological evolution (left panel) and propagation (right panel) of the discontinuity during the event of its apparent manifestation at the upper and lower clouds (see Table 1 and Fig. 1). The animation was built with geometrical projections (Ogohara et al. 2017, see level 3 data) of Akatsuki/UVI images taken at 365 nm every ∼2 h from 2022 June 13 at 16:05 UT until June 14 at 23:05 UT. These equirectangular projections consist of longitude-latitude maps with a fixed resolution of 0.125° (2880 × 1440 grids for 360° longitude and 180° latitude). The propagation of the discontinuity (right panel) is shown for maps covering latitudes 90°N–90°S and longitudes 180°–360°. For its morphological evolution (left panel) we used 60°N–60°S projections shifted to show the discontinuity at rest. The moving white spot corresponds to dead pixels. No photometric correction was applied. This interactive animation is available in PDF file using Acrobat Reader®.
Current usage metrics show cumulative count of Article Views (full-text article views including HTML views, PDF and ePub downloads, according to the available data) and Abstracts Views on Vision4Press platform.
Data correspond to usage on the plateform after 2015. The current usage metrics is available 48-96 hours after online publication and is updated daily on week days.
Initial download of the metrics may take a while.