Fig. 2.
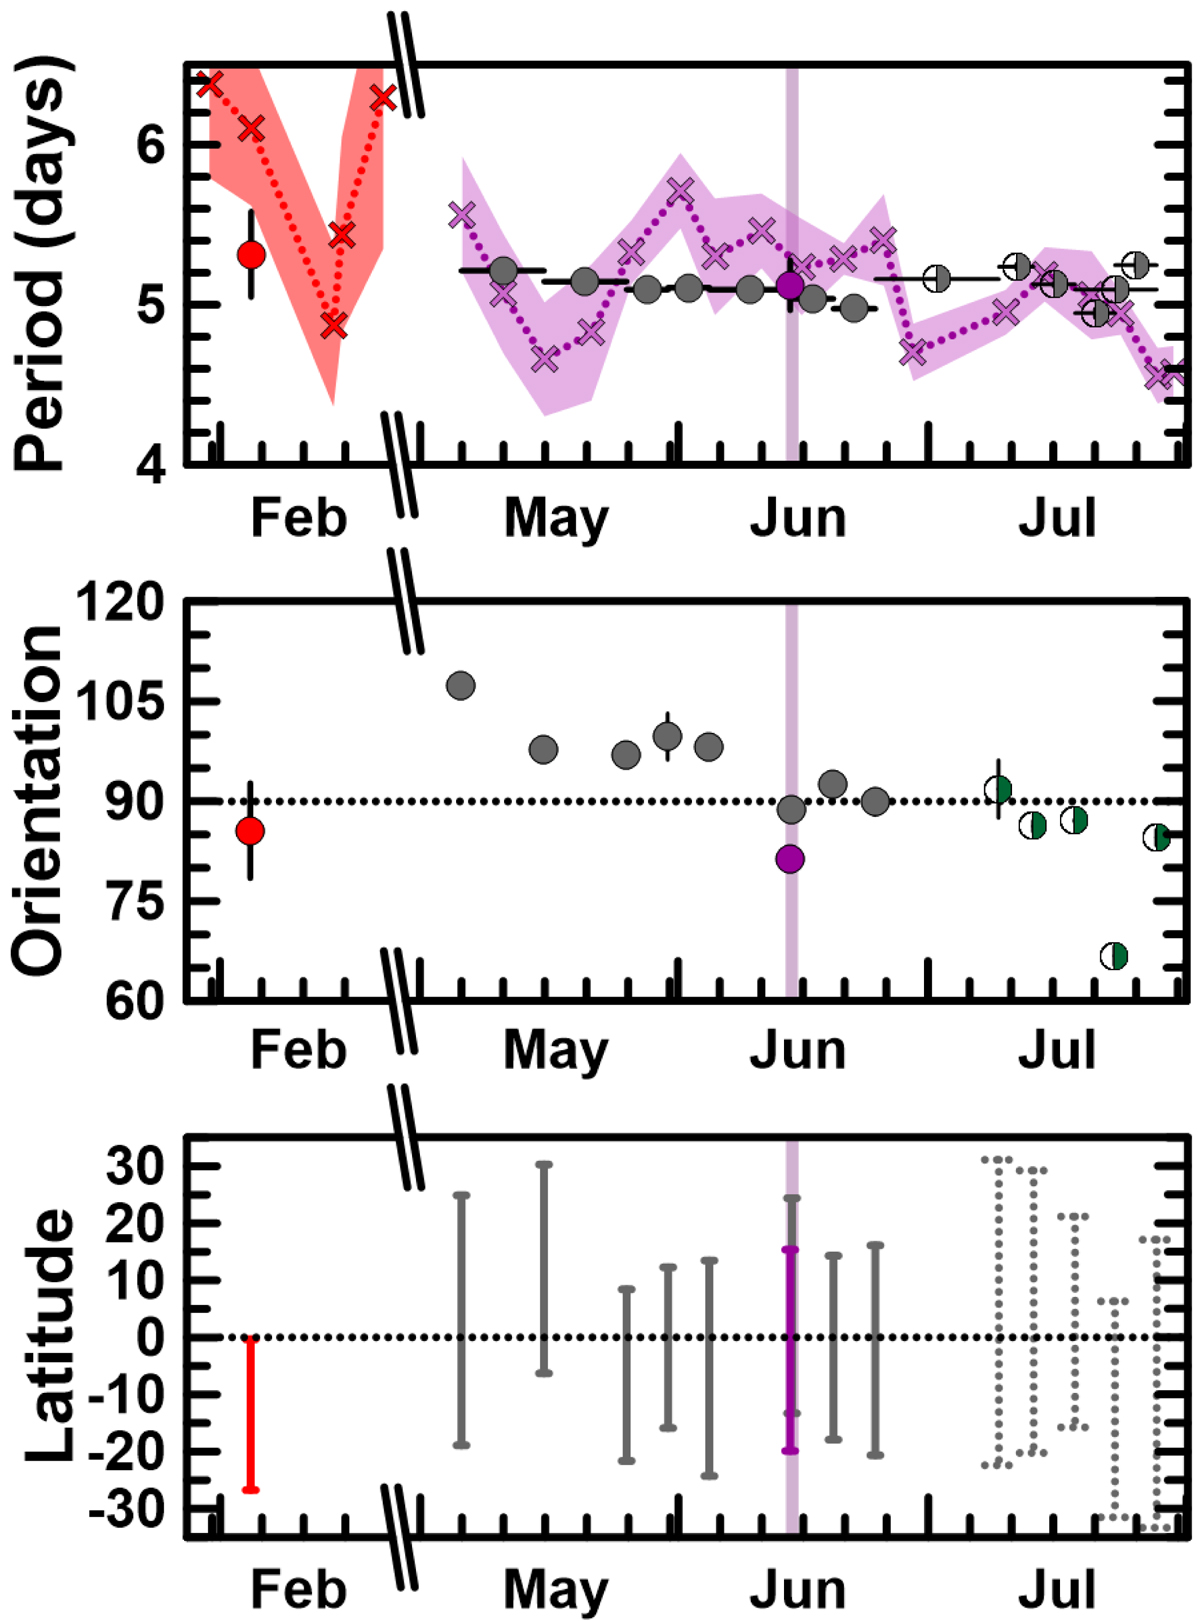
Download original image
Properties of the discontinuity during 2022. Panel (a) exhibits the rotation period (as terrestrial days) for the discontinuity zonal phase speed (circles) and zonal winds (crosses) along with their errors (bars for phase speeds, shadowed areas for winds). Red represents winds and discontinuity events at the nightside lower clouds; grey and purple correspond to dayside middle and upper clouds, respectively. Panel (b) displays the orientation of the discontinuity (circles) as degrees relative to the equator and/or parallels. Panel (c) shows the meridional coverage of the discontinuity (vertical bars). Since the discontinuity seemed to weaken during July 2022, data is displayed as half-filled circles (period and orientation) and dotted bars (meridional coverage). The time frame in light violet corresponds to the event when the discontinuity simultaneously manifested at the upper and middle clouds.
Current usage metrics show cumulative count of Article Views (full-text article views including HTML views, PDF and ePub downloads, according to the available data) and Abstracts Views on Vision4Press platform.
Data correspond to usage on the plateform after 2015. The current usage metrics is available 48-96 hours after online publication and is updated daily on week days.
Initial download of the metrics may take a while.