Open Access
Fig. 8.
Download original image
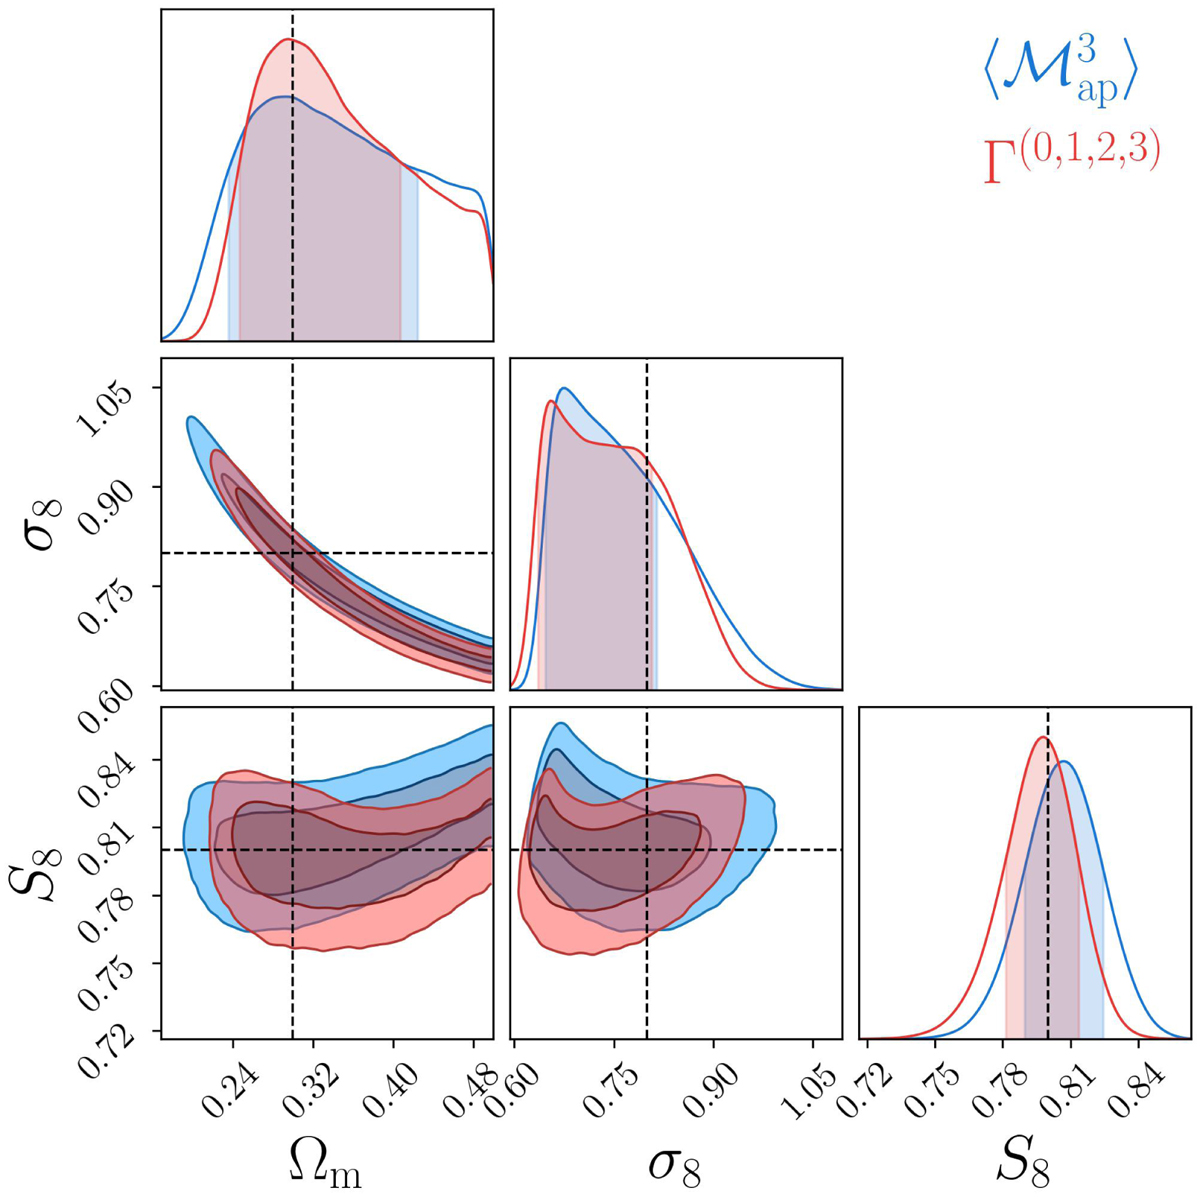
Comparison of the posterior distributions of different third-order statistics using the SLICS simulations to determine the covariance. In red we show the posteriors of the PCA from the 3pcf and in blue the one resulting from the ![]() statistic.
statistic.
Current usage metrics show cumulative count of Article Views (full-text article views including HTML views, PDF and ePub downloads, according to the available data) and Abstracts Views on Vision4Press platform.
Data correspond to usage on the plateform after 2015. The current usage metrics is available 48-96 hours after online publication and is updated daily on week days.
Initial download of the metrics may take a while.