Fig. 7.
Download original image
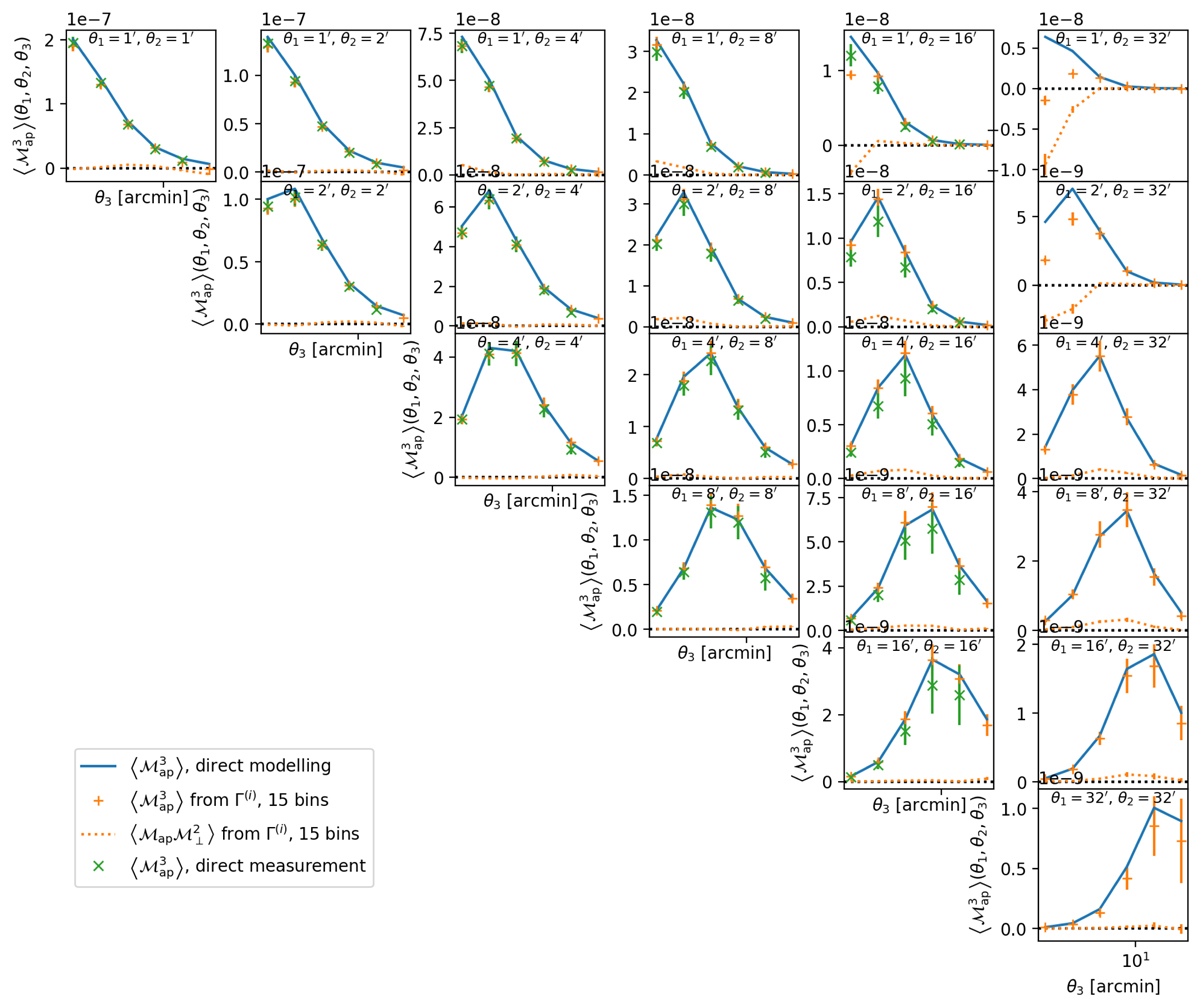
Third-order aperture masses from our modelling pipeline using B IHALOFIT (Eq. (31), blue) compared to the ones measured directly from the MS. The direct measurements on the convergence maps (Eq. (25)) are shown in green, and the measurements converted from shear 3pcf (Eq. (35)) are shown in orange. Both statistics were computed from 32 lines of sight of the MS, the error bars denote the error on the mean. We note that for the largest angle of 32′, a direct measurement could not be obtained due to the limited size of the individual light cones.
Current usage metrics show cumulative count of Article Views (full-text article views including HTML views, PDF and ePub downloads, according to the available data) and Abstracts Views on Vision4Press platform.
Data correspond to usage on the plateform after 2015. The current usage metrics is available 48-96 hours after online publication and is updated daily on week days.
Initial download of the metrics may take a while.